Curated OER
Accidents Happen: Seat Belt Laws, Enforcement, and Usage
Start with a NOVA video about car crashes, crash test dummy footage, or other video about seat belt use. Or have groups review attached data about seat belt usage (by state) and share their conclusions. Learners then devise a method to...
Curated OER
Sorting Plastics For Recycling
First, young chemists practice polymer identification by density and flame tests. With the data collected, they propose a method of separating polyethylene from other plastics and determine what property makes it desirable for recycling....
Curated OER
The Achievements and Challenges of Egypt
Awesome, that is all I have to say! This set of lessons provides learners with an understanding of ancient Egyptian laws, lifestyle, religion, and culture. It engages them in a critical analysis activity regarding the film, "The Prince...
Curated OER
Comparing SLaves and Servants in Colonial New York
Young historians compare and contrast differences in the laws that regulated the activities of slaves and servants. They review and analyze a series of primary source documents to explain the social constructs related to slaves and...
American Statistical Association
An A-MAZE-ING Comparison
Teach your class how to use descriptive statistics through a hands-on data collection activity. Pupils collect their own data, calculate test statistics, and interpret the results in context. They compare male and female results, looking...
Willow Tree
Line Plots
You can't see patterns in a jumble of numbers ... so organize them! Learners take a set of data and use a line plot to organize the numbers. From the line plot, they find minimum, maximum, mean, and make other conclusions about the data.
Los Angeles County Office of Education
Assessment For The California Mathematics Standards Grade 6
Test your scholars' knowledge of a multitude of concepts with an assessment aligned to the California math standards. Using the exam, class members show what they know about the four operations, positive and negative numbers, statistics...
Teach Engineering
Using Hooke's Law to Understand Materials
Provide a Hooke for a lesson on elasticity with an activity that has groups investigate a set of springs. They use a set procedure to collect data to calculate the spring constant for each spring using Hooke's Law. The groups predict the...
Curated OER
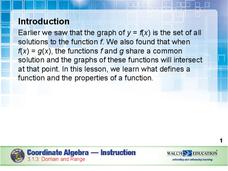
Domain and Range
Relations, and functions, and line tests, oh my! An instructional slideshow demonstrates the definitions of a relation, a function, and the domain and range of a relation. Viewers then learn how to use mappings and vertical line tests to...
McGraw Hill
Lesson 12: Absolute Mean Deviation
Learn a different way to determine variability. An informative lesson provides directions on how to calculate the mean absolute deviation of a data set. Pupils use examples to learn the process and then practice finding the mean absolute...
American Statistical Association
Don't Spill the Beans!
Become a bean counter. Pupils use a fun activity to design and execute an experiment to determine whether they can grab more beans with their dominant hand or non-dominant hand. They use the class data to create scatter plots and then...
Kenan Fellows
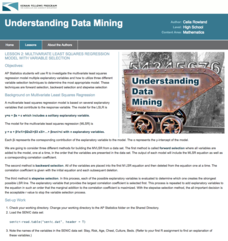
Multivariate Least Squares Regression Model with Variable Selection
The risk of contracting an infection in the hospital is low, but it does happen. Learn what risk factors have the highest correlation with hospital-acquired infections in the final lesson of a three-part series. Using the open source R...
Santa Monica-Malibu Unified School District
Parts of Speech Pre-Test: The Building Blocks of Grammar
Help your learners get a good grasp on grammar. An insightful pre-test allows teachers to learn about their young writers' knowledge of the building blocks of grammar, so they can begin building a unit of study. It includes a...
Bonneville
Titanium Dioxide Solar Cell Construction and Testing
There's raspberry juice in solar cells!? Scholars create and test a titanium dioxide raspberry solar cell in the seventh of 14 lessons in the Cost Effective Solar Cells unit. They coat glass slides with titanium dioxide to make their...
Curated OER
Organizing Data
In this organizing data worksheet, 7th graders solve seven different types of problems related to data. They first identify the type of data as categorical, discrete or continuous from the information given. Then, students use Excel to...
Curated OER
Beverage Tests
Students investigate the pH of a liquid. In this middle school mathematics/science lesson, students collect and analyze data regarding the pH of various liquids. Students display their data in various types of graphs as they consider...
Curated OER
Data Analysis: Infiltration Rate and Composition of Concrete
Students collect and graph data. In this statistics instructional activity, students analyze data using a spreadsheet program. They display their data effectively and analyze it.
Curated OER
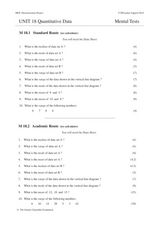
Unit 18 Quantitative Data
In this central tendency activity, students answer 30 short answer questions about data sets. Students find the median, mean, mode, and range of data sets.
Curated OER
Presentation of Quantitative Data- Vertical Line Diagrams
In this quantitative data worksheet, students examine how vertical line diagrams can be used to display discrete quantitative data. They read about the use of tally charts to create vertical line graphs that display the data. They...
Curated OER
Hand Lotion Analysis
Students prepare a sample of a commercial hand lotion for analysis by HPLC to determine the percent composition of two common cosmetic preservatives, methylparaben and propylparaben. They perform the analysis and the data is evaluated to...
Curated OER
Analysis of the Concentration of Sodium Chloride in a Product
Students design an experiment to test for the concentration of chloride in products. In this analysis of chloride concentration lesson plan, students develop and conduct an experiment to find the amount of chloride ion in a substance of...
Curated OER
"Too Much Pressure" by Colleen Wenke
Have you ever cheated on a test? What about copied someone else's homework? After reading Colleen Wenke's essay "Too Much Pressure," class members use the provided reading comprehension questions to focus their analysis of important...
Mr. T Davis
Major Works Data Sheet
Ease the anxiety of preparing for the AP English exams with a four-page packet test-takers can use to record key information about major works they have read. In addition to biographical information about the author, historical...
Curated OER
Handling Data: Representing Date - Online Version
Here is an online lesson plan on data representation. In it, learners access websites embedded in the plan which lead them through a variety of activities around data representation and statistics. The activities are quite good, and...
Other popular searches
- Art Criticism Test
- Proverb Analysis Test
- Water Quality Testing Data
- Poetry Analysis Test
- Data Test
- Data and Statistics Test


