US Department of Commerce
Educational Attainment and Marriage Age - Testing a Correlation Coefficient's Significance
Do women with college degrees get married later? Using a provided scatter plot of the percentage of women who earn bachelor's degrees and the median age at which women first get married over time, pupils conduct a linear regression...
Curated OER
Graphing With RXTE
Students use data from the Rossi X-ray Tiiming Explorer (RXTE) satellite to analyze and graph.
Curated OER
Dealing With Data
Students collect, organize, and display data using a bar graph, line graph, pie graph, or picture graph. They write a summary describing the data represented and compare the graph to another graph in the class.
Curated OER
North vs. South
Students use information about the Union and Confederate troops to create a bar graph. In this graphing lesson, students graph troop information on a bar graph, color coding the information. Students then find the differences...
Curated OER
Australian Settlers
Students interpret graphs and research events to identify links between events in the world and the arrival and plight of immigrant groups. They discuss the myths about immigration.
Curated OER
Our Favorites
Students participate in and conduct a survey to determine various class favorites. They collect, organize and display their data, interpret the results, and complete a packet of worksheets to display the information.
Curated OER
What's Your Line?
Fifth graders collect temperature readings over a period of time, enter the information into a spreadsheet and choose the appropriate graph to display the results.
Curated OER
Let's Go Slopey
Students create a table of values to graph a line. In this algebra lesson, students identify the slope and intercept of a linear equation. They use a Ticalculator to graph their function.
Curated OER
Line & Scatter (What Would You Use: Part 2)
Young scholars discuss line graphs and scatter plots and the best situations in which to use them. Using the graphs, they determine the type of correlation between variables on a scatterplot. They create a scatterplot and line graph...
Curated OER
Survey Says...
Learners practice taking surveys to answer different questions about radio. In this communications lesson, students brainstorm to create questions they can ask strangers about how often they listen to their radio. Learners...
Curated OER
Moving Straight Ahead
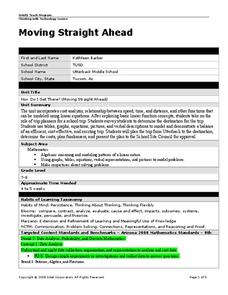
Pupils analyze the relationship between speed, time and distance. In this math instructional activity, students plan a school trip. Pupils determine the efficiency and cost effectiveness of a trip.
Curated OER
French Fry Run
Student explore estimation and measurement. In this measurement lesson, 2nd graders measure french fries, graph their data, and determine the size of french fries that is the best value. Students practice how to add prices and calculate ...
Curated OER
The Lake Effect
Fourth graders conduct an experiment demonstrating the effects of water and air temperature on precipitation. They create graphs demonstrating their findings using Claris Works for Kids.
Curated OER
Christmas Presents
Seventh graders create a graph of their Christmas gifts. They develop categories, compute fractional and decimal parts for each category, identify the number of degrees to represent each fractional part, and create a circle graph to...
Curated OER
Help! I Need Five Minutes
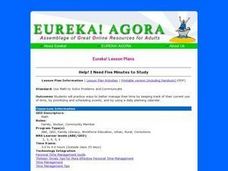
Students practice ways to better manage their time. They keep track of their current use of time. Students prioritize and schedule events and use a daily planning calendar to schedule their time.
Curated OER
Songs from the Past
Young scholars research songs from the past to learn about historical events. In this music history lesson, students conduct a survey on the Star-Spangled Banner, research the song and history on various websites, and research songs in...
Curated OER
Money Circulation: A Story of Trade and Commerce
Students are introduced to the meaning, symbolism, and value of the quarter. They determine the percentage of total monetary value held in quarters and graph the results. Students infer about the U.S. Mint's distrubution of coins. They...
Curated OER
Population Patterns
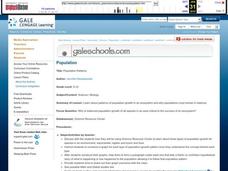
Students study patterns of population growth in an ecosystem and why populations must remain in balance. They interpret basic population graphs and suggest scenarios about different population growth patterns in an ecosystem.
Curated OER
A Thanksgiving Survey
Students take a survey then use the information gained from the survey to help plan a typical Thanksgiving dinner for our last day of class. They create a graph which corresponds the the data gathered during interviews.
Curated OER
Pecan Power
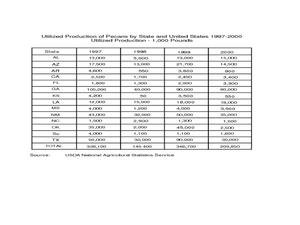
Students study the origins of pecans and complete a bar graph from the data they have discovered. In this pecan lesson plan, students draw pecans, discuss a pecan time line, and draw a bar graph comparing Arizona pecans to other...
Curated OER
Effects of chemical use in Agriculture
Students research environmental data to create a bar graph. In this agricultural ecology instructional activity, students research the pros and cons of chemical use in farming. Students debate on passing a law to reduce chemical use.
Curated OER
Understanding the Geologic Timescale
Students identify and analyze how the geologic time scale was developed by investigating 11 periods of time and the vast expanse of time of the Earth's existence. They study their period, determine the important factors indicative to...
Curated OER
Falling Objects
High schoolers examine the velocities of two different falling objects. They produce distance vs. time and velocity vs. time graphs using a Motion Detector and a CBL 2 to collect experimental data. Learners analyze and interpret the...
Curated OER
Chances Are
Upper graders examine the concept of probability. They collect data and create a bar graph. They must interpret the data as well. Everyone engages in hands-on games and activities which lead them to predict possible outcomes for a...


