Curated OER
Using Bar Graphs to Understand Voting Patterns
Bar graphs are used as a way to study voting patterns in the United States. A variety of statistical data is presented in the graphs, and pupils must interpret the data in order to make a report to the class. Three excellent graphs,...
Curated OER
Rockefeller's Revenge: Exxon and Mobil Unite
Study the impact and possible outcomes of the Exxon-Mobil merger in your language arts, social studies, or economics class. Secondary learners evaluate a series of graphs, write a paragraph interpreting the data, and engage in class...
Anti-Defamation League
Women’s Inequity in Pay: Could It Be Sexism, Implicit Bias or Both?
Equal pay for equal work? High schoolers research the reasons for the inequity in women's pay. They read articles, examine graphs, engage in discussion, and then craft an essay in which they suggest a way to address the gender wage gap.
PBS
Real-World Proportional Relationships: Gender Wage Gap
When will the gender wage gap disappear? Scholars use a provided infographic to see trends in wage gap over time. They use ratios of women's wages to men's wages to determine which decades had the greatest change in the wage gap. The...
US Department of Commerce
Immigration Nation
People come and people go. Given tabular census data on the annual number of immigrants from four different regions of the world between 2000 and 2010, pupils create double bar graphs and line graphs from the data. They analyze their...
PBS
The Lowdown — What You Need to Know about Immigration Reform
We're all from somewhere. An informative interactive provides information on immigration, foreign-born residents, and deportations. Pupils interpret the graphics to analyze how these quantities have changed over time. The resource is...
Curated OER
How Times Have Changed
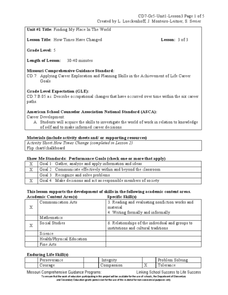
Fifth graders work in small groups to compile job changes. They use data from the list of changes that the group generated together. Students analyze the data to determine: categories of changes, patterns or trends of changes, and future...
The New York Times
The Careful Reader: Teaching Critical Reading Skills with the New York Times
The 11 lessons in this educators' guide focus on using newspapers to develop critical reading skills in the content areas.
Curated OER
Graphing and Analyzing Biome Data
Students explore biome data. In this world geography and weather data analysis instructional activity, students record data about weather conditions in North Carolina, Las Vegas, and Brazil. Students convert Fahrenheit degrees to Celsius...
Curated OER
Wind Effects- A Case Study
Students explore hurricanes. In this weather data interpretation lesson, students draw conclusions about the impact of Hurricane Floyd as it related to weather conditions. Students read and interpret a tide data table, a barometric...
Curated OER
Creating Climographs
Students chart statistical information on graphs, interpret the information and use it to explain spatial relationships, and identify the relationship between climate and vegetation.
Curated OER
Snack Time
In this activity, students will color the correct number of boxes in a graph to show their choices. They will then display their understanding of the graph's meaning through a teacher led class discussion.
Curated OER
Data Comparison And Interpretation: North Korea, South Korea, And the United States
Ninth graders brainstorm "what they know about North Korea and South Korea." They determine the approximate distance from the United States to North and South Korea and create a graph comparing the birth rates, death rates, infant...
Federal Reserve Bank
FRED in the Classroom: Measures of Inflation
Don't just tell class members about how to measure inflation, have them experience it firsthand by asking them to work with real data and construct graphs!
Curated OER
North vs. South
Students use information about the Union and Confederate troops to create a bar graph. In this graphing lesson, students graph troop information on a bar graph, color coding the information. Students then find the differences...
Curated OER
Australian Settlers
Students interpret graphs and research events to identify links between events in the world and the arrival and plight of immigrant groups. They discuss the myths about immigration.
Curated OER
Survey Says...
Learners practice taking surveys to answer different questions about radio. In this communications lesson, students brainstorm to create questions they can ask strangers about how often they listen to their radio. Learners...
Curated OER
Songs from the Past
Young scholars research songs from the past to learn about historical events. In this music history lesson, students conduct a survey on the Star-Spangled Banner, research the song and history on various websites, and research songs in...
Curated OER
Money Circulation: A Story of Trade and Commerce
Students are introduced to the meaning, symbolism, and value of the quarter. They determine the percentage of total monetary value held in quarters and graph the results. Students infer about the U.S. Mint's distrubution of coins. They...
Curated OER
A Thanksgiving Survey
Students take a survey then use the information gained from the survey to help plan a typical Thanksgiving dinner for our last day of class. They create a graph which corresponds the the data gathered during interviews.
Curated OER
Pecan Power
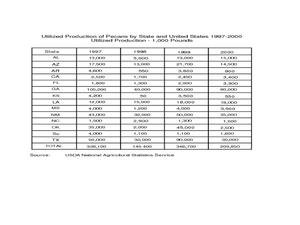
Students study the origins of pecans and complete a bar graph from the data they have discovered. In this pecan lesson plan, students draw pecans, discuss a pecan time line, and draw a bar graph comparing Arizona pecans to other...
Curated OER
Effects of chemical use in Agriculture
Students research environmental data to create a bar graph. In this agricultural ecology instructional activity, students research the pros and cons of chemical use in farming. Students debate on passing a law to reduce chemical use.
Curated OER
Graphing Population Around the World
Students define specific vocabulary necessary for understanding population data. They collect, analyze, and interpret specific data. They utilize computer programs in order to create graphs of collected data.
Curated OER
Great Lakes Homepage for Kids
Here are some outstanding lessons on the geology and history of the Great Lakes. These lessons are divided into Grade 4 -6, and Grade 7 - 8 activities. The activities all use the background information, maps, graphs, data, and Great...


