Curated OER
Cartoons for the Classroom: John Q. Public
John Q. Public was a notable cartoon representation of the average American; but how accurate was this portrayal? Emergent analysts consider several topical points as they take a critical look into a cartoon portrayal of the American...
EngageNY
Mid-Unit 1 Assessment: Human Rights Vocabulary and Common Prefixes
Here is a mid-unit assessment for a group of lessons studying the Universal Declaration of Human Rights (UDHR). The first half of this instructional activity calls for several forms of review. Your class will review the content of the...
Curated OER
James and The Giant Peach Vocabulary Building Activities
Reading literature is one of the best ways for kids to build a strong vocabulary while honing in on their comprehension skills. These vocabulary activities go along with the wonderful book, James and the Giant Peach. The children will...
Illustrative Mathematics
Roll & Build
Develop young mathematicians' understanding of place value with this hands-on math activity. Working in pairs, learners take turns building two-digit numbers by rolling two ten-sided dice. Base ten blocks are then used to model the...
Project Maths
Complex Number Operations
What do animated videos have to do with mathematics? Using operations of complex numbers and their representations on the complex plane, high schoolers observe how mathematics could be used to move animations. The lesson provides an...
EngageNY
Systems of Equations
What do you get when you cross a circle and a line? One, two, or maybe no solutions! Teach learners to find solutions of quadratic and linear systems. Connect the visual representation of the graph to the abstract algebraic methods.
Mathematics Vision Project
Module 1: Functions and Their Inverses
Nothing better than the original! Help your class understand the relationship of an inverse function to its original function. Learners study the connection between the original function and its inverse through algebraic properties,...
EngageNY
Exploiting the Connection to Cartesian Coordinates
Multiplication in polar form is nice and neat—that is not the case for coordinate representation. Multiplication by a complex number results in a dilation and a rotation in the plane. The formulas to show the dilation and rotation are...
EngageNY
Matrix Addition Is Commutative
Explore properties of addition as they relate to matrices. Using graphical representations of vector matrices, scholars test the commutative and associative properties of addition. They determine if the properties are consistent for...
Balanced Assessment
On Averages and Curves
Determine the average on a curve. The class finds graphical representations of averages and expresses them both symbolically and on the graph. The assessment requires class members to justify using average to describe graphs.
EngageNY
Comparing Linear Functions and Graphs
How can you compare linear functions? The seventh installment of a 12-part module teaches learners how to compare linear functions whose representations are given in different ways. They use real-world functions and interpret features in...
EngageNY
Comparison Shopping—Unit Price and Related Measurement Conversions
Speed up your scholars' understanding of ratios. Class members compare ratios related with speeds presented in different representations. They then use the unit rates to make the comparisons.
EngageNY
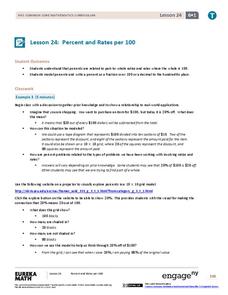
Percent and Rates per 100
What percentage of your class understands percents? Pupils learn the meaning of percents based upon rates per 100 in the 24th lesson in a series of 29. They represent percents as fractions, decimals, ratios, and models. The scholars...
EngageNY
The Mean as a Balance Point
It's a balancing act! Pupils balance pennies on a ruler to create a physical representation of a dot plot. The scholars then find the distances of the data points from the balance point, the mean.
Curated OER
Using Logos and Mission Statements to Communicate Sustainable Forestry Information
Young scholars survey forestry foundations to see how they represent important information into their logos and mission statements. In this forestry lesson plan, students use the information to better understand visual representations...
Curated OER
Under the Umbrella
Students complete a variety of activities related to the short /u/ sound. As a class they recite a tongue twister, then trace and write the letter U. Students then listen to a list of words and identify the words containing the short...
Curated OER
Under Pressure: How Deep Can They Dive?
Students explore geography by conducting an in-class experiment. In this deep sea exploration lesson, students identify the different zones of the ocean and utilize water bottles, masking tape and scissors to conduct a water pressure...
Curated OER
How Poets Evoke Social and Historical Representations
Students explore how poems represent the social, historical, and cultural times that they were written in. In this poetry lesson plan, students compare and contrast poems with music of the time and explore implications of writing poems...
Curated OER
Cultural Representation in "Spellbound" Part 1
Students watch the film "Spellbound". They analyze concepts of how the media represents race. They discuss how the movie depicts race after the film.
Curated OER
The Power of Graphical Display: How to Use Graphs to Justify a Position, Prove a Point, or Mislead the Viewer
Analyze different types of graphs with learners. They conduct a survey and determine the mean, median and mode. They then identify different techniques for collecting data.
Perkins School for the Blind
Let's Pretend
Playing pretend with real objects or concepts is a wonderful way for learners to make object-to-action connections, as well as practice daily living skills. Learners with visual and intellectual disabilities use a wide variety of real...
Curated OER
Symbolic Family Flags
After learning a bit about symbolism and view the Australian flag, learners make one of their own. They discuss how flags and art can symbolically express ideas or feelings, design three symbols, and construct a flag that represents...
Curated OER
The World of Work
Young scholars practice appropriate behavior during a mock job interview. In this interview skills lesson plan, students identify a career using the given websites. Young scholars answer questions in preparation for the job interview and...
Curated OER
Using Numbers Everywhere
Kindergarteners explore various representations and uses of numbers to develop number sense. They participate in an activity and arrange patterns into groups. Students compare the sets and describe the objects in each set.


