Curated OER
Career Magic
Fifth graders gather information about the roles, responsibilities, skills, and training and education requirements of workers. Then they input this information into a graphic organizer chart and identify the similarities and differences...
American Statistical Association
Chocolicious
To understand how biased data is misleading, learners analyze survey data and graphical representations. They use that information to design their own plans to collect information on consumer thoughts about Chocolicious cereal.
West Contra Costa Unified School District
Correlation and Line of Best Fit
Computers are useful for more than just surfing the Internet. Pupils first investigate scatter plots and estimate correlation coefficients. Next, they use Microsoft Excel to create scatter plots and determine correlation...
Statistics Education Web
Are Female Hurricanes Deadlier than Male Hurricanes?
The battle of the sexes? Scholars first examine data on hurricane-related deaths and create graphical displays. They then use the data and displays to consider whether hurricanes with female names result in more deaths than hurricanes...
American Psychological Association
Using Psychological Perspectives to Answer Questions on Behavior
Perspective is everything when it comes to assessing human behavior. Class members examine a series of statements and identify the perspective represented by each to demonstrate their understanding of different psychological perspectives.
Teach Engineering
Balsa Glider Competition
Change one variable and try again. Teams build basic balsa gliders and collect data on their flight distances and times. Through collaboration, the team decides on two modifications to make to the basic design and collect data for the...
Curated OER
Earth: Our Big Blue Marble
Students investigate Earth and its resources. For this Earth, space, and nature lesson plan, students collaborate to design presentations on the Earth, its cycles, and how humans have impacted the planet. Images, diagrams, and background...
Curated OER
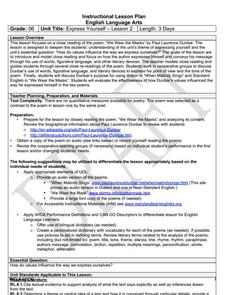
6th Grade: Express Yourself, Lesson 2: Close Read
The second lesson of a pair about Paul Laurence Dunbar, this plan focuses in particular on his poem, "We Wear the Masks." After a short historical introduction, class members conduct a series or readings, marking up the text and...
Teach Engineering
The Grand Challenge: Fix the Hip Challenge
It may be time to get to know the skeletons in your family. The first lesson in a series of 5, introduces the class to the concept of osteoporosis. The class members brainstorm possible causes and whether the family should be concerned...
Illustrative Mathematics
Delivery Trucks
Algebra learners are to make sense of two different-sized sand trucks and the number of trips each truck makes. The resource lists four different expressions based on the size of each truck and the number of deliveries the trucks make....
Curated OER
Understanding Dialect as Used by Mark Twain
A reading of Mark Twain’s The Celebrated Jumping Frog of Calaveras County not only offers pupils an opportunity to practice their listening skills but also provides them with examples of dialectic speech. This is the gol’derndest lesson...
NOAA
Ocean Layers I
How is it possible for ocean water to have layers? The sixth installment of a 23-part NOAA Enrichment in Marine sciences and Oceanography (NEMO) program investigates factors that cause different water densities to occur. Experiments...
Cornell University
Nano Interactions
Tiny particles can provide big learning opportunities! Middle school scientists explore the world of nanoparticles through reading, discussion, and experiment. Collaborative groups first apply nanotechnology to determine water...
Alabama Learning Exchange
Polygons-Changing Area Versus Changing Perimeter
Investigate the area and perimeter of polygons in this geometry lesson. Young geometers use grid paper to draw a quadrilateral and calculate its area and perimeter. They also read The Greedy Triangle to identify the changing shape of...
Curated OER
Resources and Economic Development
Identify natural resources in the world and how they translate into economic development. In this global economy instructional activity, your class will utilize the Internet to view an Oregon Time Web which they research to examine the...
Friends of Fort McHenry
Cannons During the War of 1812
During the Battle of Baltimore in the War of 1812, only 25% of the bombs and rockets fired at Fort McHenry actually reached their target. Using an interactive online simulation, combine your historical study with physics and...
Curated OER
Button Bonanza
Collections of data represented in stem and leaf plots are organized by young statisticians as they embark some math engaging activities.
Curated OER
The Pythagorean Theorem and Classifying Triangles
Through the examination of the relationship between the lengths of the sides of a triangles learners will learn the classification of triangles (acute, right, or obtuse).
Curated OER
Fire Fighting Crew
Students use the concepts in statistics to make decisions. They calculate the mean, median and mode. They compare one firefighter against another and analyze the data. They share their information with the class.
Curated OER
A Horse of a Different Color
Elementary schoolers explore the wide variety of horse coat colors and reproduce an existing color as well a create their own horse coat color. There are two fine worksheets embedded in this plan that learners use to crete these coat...
Curated OER
On The Go! Forces and Motion
Students create a car using physics. In this forces and motion lesson plan, students create a car and test which changes in design change the performance of the car. Students complete a graphic organizer with the different...
Curated OER
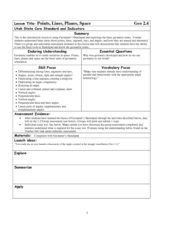
Points, Lines, Planes, and Space
For this points, lines, planes, and space worksheet, students solve word problems dealing with points, lines, planes, and space. Students complete 20 individual problems and 20 group problems.
Curated OER
Air Pressure
Learners participate in a series of demonstrations about Bernoulli's principle. They explain how air pressure varies with air speed. They write a detailed lab report about the activity. This is a great way to explore this concept.
Purdue University
Design of an Earthen Dam for a Lafayette Neighborhood
How do dams support bodies of water? Scholars engage in a hands-on STEM activity where they design, build, and test dams to learn about bodies of water and how humans use natural resources. They learn how criteria and constraints affect...


