Curated OER
A Thanksgiving Survey
Students take a survey then use the information gained from the survey to help plan a typical Thanksgiving dinner for our last day of class. They create a graph which corresponds the the data gathered during interviews.
Curated OER
Variables and Patterns: Determining an appropriate scale while graphing
Sixth graders determine appropriate scales when graphing data. In this graphing instructional activity, 6th graders use an the applet "Graph It" to determine what is an appropriate scale for their data.
Curated OER
Survey Says...
Learners practice taking surveys to answer different questions about radio. In this communications lesson, students brainstorm to create questions they can ask strangers about how often they listen to their radio. Learners...
Curated OER
Impact!!
Learners perform a science experiment. In this algebra instructional activity, students collect data from their experiment and create a graph. They analyze the graph and draw conclusion.
Curated OER
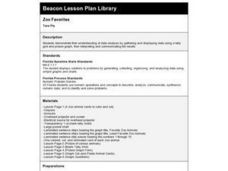
Zoo Favorites
First graders construct a class picture graph and tally grid that show their favorite zoo animals. They discuss the information the graphs show and complete a personal graph based on the class example.
Curated OER
Loving Literature
First graders, after having "Are You My Mother?" by P.D. Eastman read to them, participate in group discussions or independentally work to analyze a spreadsheet to identify essential elements in the story and graph their data. In...
Curated OER
Money Circulation: A Story of Trade and Commerce
Students are introduced to the meaning, symbolism, and value of the quarter. They determine the percentage of total monetary value held in quarters and graph the results. Students infer about the U.S. Mint's distrubution of coins. They...
Curated OER
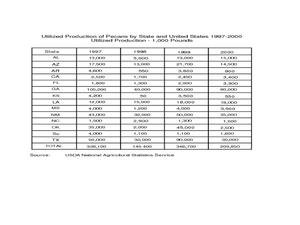
Pecan Power
Students study the origins of pecans and complete a bar graph from the data they have discovered. In this pecan lesson plan, students draw pecans, discuss a pecan time line, and draw a bar graph comparing Arizona pecans to other...
Curated OER
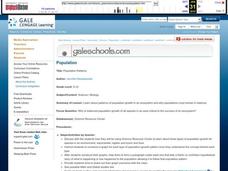
Population Patterns
Students study patterns of population growth in an ecosystem and why populations must remain in balance. They interpret basic population graphs and suggest scenarios about different population growth patterns in an ecosystem.
Curated OER
Learning to Make Data Tables
Students construct data tables using the results of previous experiments. In this graphing lesson, students plot data and interpret the results. Students discuss how they organized their data.
Curated OER
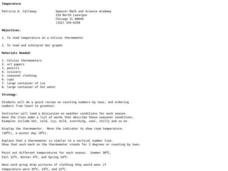
Temperature
Students explore the concept of temperature. In this temperature instructional activity, students read thermometers in degrees Celsius. Students discuss the temperature of the seasons and what clothing they might wear given a certain...
Curated OER
Local Traffic Survey
Students conduct a traffic survey and interpret their data and use graphs and charts to display their results.
Curated OER
Songs from the Past
Young scholars research songs from the past to learn about historical events. In this music history lesson, students conduct a survey on the Star-Spangled Banner, research the song and history on various websites, and research songs in...
Curated OER
Checking Test Comparability/Scattergrams
Students construct a scattergram graph. In this statistics lesson, students graph data by hand and using a spreadsheet program. They establish lines of best fit and draw conclusions using their graphs.
Curated OER
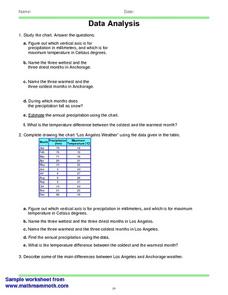
Data Analysis 2
In this data analysis worksheet, students read and interpret given line graphs. They determine the range and average. This one-page worksheet contains five problems.
Curated OER
Table Readings
In this table activity, students read questions and interpret tables. Questions include information concerning unemployment, oil imports, and foreign students. This multiple-choice activity contains 10 problems. ...
Curated OER
Multiple Representations
Every topic or subject has its own special jargon. Learners work on their math vocabulary as it relates to basic algebra terms. They define and identify function, functional notation, ordered pairs, rate of change, slope,...
Curated OER
Interpreting Data and Building Hypothesis
Students define the term species, and graph species data together with previously collected data at the National Zoo. They interpret graphed data and recognize patterns in the streamside quadrant versus hillside quadrant. Students use...
Curated OER
Epsilon-Delta Window Challenge
Students graph functions and analyze them. In this calculus lesson, students define limit formally using Epsilon-Delta. They use the TI to graph the function and analyze it.
Curated OER
A Steep Hike
Students explore slope. In this middle school mathematics lesson, students analyze and interpret graphs as they investigate slope as a rate of change. Students use a motion detector to collect data as they walk at different...
Curated OER
Domain and Range
Your class will grasp the concept of domain-and range on a graph by using their TI navigator to graph their lines. They observe the effect of a function and non-functions based on the domain and range.
Curated OER
Measuring Rainfall and Relationships Between pH, Alkalinity and Suspended Solids in the Pago River
Eleventh graders test the pH and alkalinity of Pago River. In this ecology instructional activity, 11th graders collect data and use spreadsheet to graph results. They analyze and share their findings with the class.
Curated OER
Linear Motion 5
In this linear motion worksheet, students answer 9 questions about velocity, acceleration and position of objects. They solve problems for acceleration and velocity and they interpret graphs of velocity vs. time, acceleration vs. time...
Curated OER
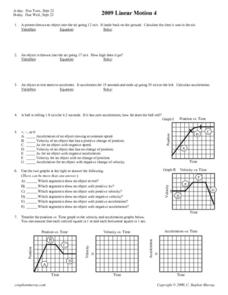
Linear Motion 4
In this linear motion worksheet, learners answer 12 questions including finding acceleration of moving objects, calculating distance objects travel and determining the time of travel. Students interpret graphs of position vs. time,...


