Virginia Department of Education
States and Forms of Energy
Energy is just energy, right? Explain various forms of energy to your young scientists by using an interactive experiment that contains common objects to demonstrate complex concepts. Pupils conduct experiments for radiant, thermal,...
Teach Engineering
Cartesian Diver
Amaze your scholars with an activity that uses a Cartesian diver to demonstrate Pascal's Law, Archimedes' Principle, and the Ideal Gas Law. Groups then repeat the process and make their own diver move up and down in a bottle.
EngageNY
Piecewise and Step Functions in Context
Looking for an application for step functions? This activity uses real data to examine piecewise step functions. Groups create a list of data from varying scenarios and create a model to use to make recommendations to increase...
EngageNY
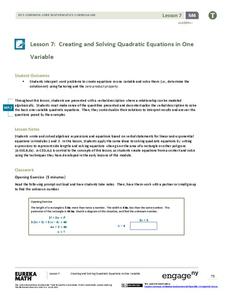
Creating and Solving Quadratic Equations in One Variable
Give your classes practice at modeling using quadratic models with a resource that uses area and integer problems to allow individuals to create second degree polynomials. Young mathematicians solve equations using factoring and then...
EngageNY
Congruence Criteria for Triangles—ASA and SSS
How do you know if a pair of triangles are congruent? Use the lesson to help class members become comfortable identifying the congruence criteria. They begin with an exploration of ASA and SSS criteria through transformations and...
TryEngineering
Computing in the Cloud
What and where is "the cloud"? The lesson teaches scholars about the history of cloud computing and about its current uses. It also teaches how to install a multiple guest OS in a host OS and how to use cloud computing services.
Pearson
Non-Action Verbs
A verb is something you do — but can you always see the action? Use a slideshow presentation to clarify the differences between verbs that describe actions, and verbs that describe senses, preferences, and emotions.
EngageNY
Dilations on the Coordinate Plane
Dilations from the origin have a multiplicative effect on the coordinates of a point. Pupils use the method of finding the image of a point on a ray after a dilation to find a short cut. Classmates determine the short cut of being...
EngageNY
The Converse of the Pythagorean Theorem
Is it a right triangle or not? Introduce scholars to the converse of the Pythagorean Theorem with a lesson that also provides a proof by contradiction of the converse. Pupils use the converse to determine whether triangles with given...
EngageNY
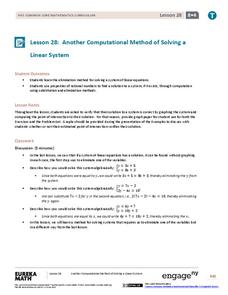
Another Computational Model of Solving a Linear System
The process of elimination really works! Use elimination when substitution isn't doing the job. The 29th segment in a series of 33 introduces the elimination method to solving linear systems. Pupils work several exercises to grasp the...
EngageNY
Systems of Equations Leading to Pythagorean Triples
Find Pythagorean Triples like the ancient Babylonians. The resource presents the concept of Pythagorean Triples. It provides the system of equations the Babylonians used to calculate Pythagorean Triples more than 4,000 years ago. Pupils...
Virginia Department of Education
Logarithmic Modeling
Explore logarithms and logarithmic regression. Young mathematicians first learn about inverse functions and about the logarithm function family. They take their newfound knowledge to use logarithmic functions to model situations and...
Virginia Department of Education
Exponential Modeling
Investigate exponential growth and decay. A set of six activities has pupils collecting and researching data in a variety of situations involving exponential relationships. They model these situations with exponential functions and solve...
EngageNY
Tax, Commissions, Fees, and Other Real-World Percent Problems
Pupils work several real-world problems that use percents in the 11th portion of a 20-part series. The problems contain percents involved with taxes, commissions, discounts, tips, fees, and interest. Scholars use the equations formed for...
PBL Pathways
Students and Teachers 2
Examine trends in student-to-teacher ratios over time. Building from the first task in the two-part series, classes now explore the pattern of student-to-teacher ratios using a non-linear function. After trying to connect the pattern to...
EngageNY
Computing Actual Lengths from a Scale Drawing
The original drawing is eight units — how big is the scale drawing? Classmates determine the scale percent between a scale drawing and an object to calculate the length of a portion of the object. They use the percent equation to find...
California Education Partners
Eleven
It is difficult to articulate how growing up feels as accurately and beautifully as Sandra Cisneros does in her short story "Eleven." After seventh graders read the story and note the author's use of figurative language, they respond to...
Virginia Department of Education
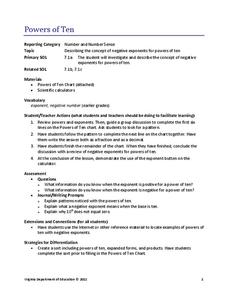
Powers of Ten
Investigate negative exponents of-ten. Pupils use the pattern of increasing powers of 10 to determine negative powers of 10. The scholars write the powers in expanded and product forms and make the connection to exponents using a...
EngageNY
The Relationship of Division and Subtraction
See how division and subtraction go hand-in-hand. The fourth installment of a 36-part module has scholars investigate the relationship between subtraction and division. They learn using tape diagrams to see that they can use repeated...
Shodor Education Foundation
Data Flyer
Fit functions to data by using an interactive app. Individuals plot a scatter plot and then fit lines of best fit and regression curves to the data. The use of an app gives learners the opportunity to try out different functions to see...
Shodor Education Foundation
Conic Flyer
Graphing conics made easy. Individuals use an interactive to graph conic sections. The app can handle circles, vertical and horizontal parabolas, ellipses, and vertical and horizontal hyperbolas.
Shodor Education Foundation
Regression
How good is the fit? Using an interactive, classmates create a scatter plot of bivariate data and fit their own lines of best fit. The applet allows pupils to display the regression line along with the correlation coefficient. As a final...
Shodor Education Foundation
Scatter Plot
What is the relationship between two variables? Groups work together to gather data on arm spans and height. Using the interactive, learners plot the bivariate data, labeling the axes and the graph. The resource allows scholars to create...
Shodor Education Foundation
Multi-Function Data Flyer
Explore different types of functions using an interactive lesson. Learners enter functions and view the accompanying graphs. They can choose to show key features or adjust the scale of the graph.
Other popular searches
- Addition Using Manipulatives
- Creating Art Using Music
- Chemical Change Using Apples
- Lessons Using Apples
- Multiplying Using Arrays
- Math Using Arctic Animals
- Addition Using Grouping
- Addition Using Unifix Cubes
- Adding Decimals Using Money
- Cultural Studies Using Math
- Add Fractions Using Pictures
- Addition Using Manipulative's


