CK-12 Foundation
Writing Basic Equations: Stars and Moons
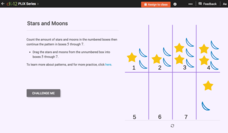
You'll be over the moon about finding a useful resource for describing patterns. Aspiring mathematicians drag moon and star shapes to complete a shape pattern. Additionally, they must write an algebraic equation to describe the pattern.
CK-12 Foundation
Chemical Bonds: Covalent and Ionic Bonding
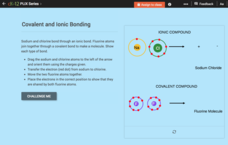
Get back to bonding basics. Science scholars get a chance to show what they know using a simple interactive. Pupils create models of covalent and ionic bonds before answering questions about each interaction. The resource includes a...
CK-12 Foundation
Inequalities that Describe Patterns: Freezing Cold Comparison
Don't freeze out the interactive on inequalities from your lesson plans. Young mathematicians use an interactive thermometer and number line to compare freezing temperatures. Inequalities help express these comparisons.
CK-12 Foundation
Evaluate Expressions with One or More Variables: Water Bottle Expression
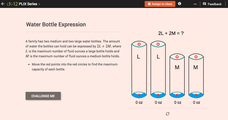
Fill your mind as you fill virtual water bottles. Pupils use an interactive to find the amount of water that can fit in given containers. Writing and evaluating an algebraic expression helps with this task.
CK-12 Foundation
Algebra Expressions with Exponents: Fish Tank Cube
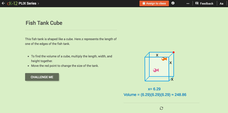
There's nothing fishy about this resource. A slider interactive lets users adjust the side length of a fish tank cube. It aids in seeing changes in the volume and how to express the volume using an algebraic expression.
CK-12 Foundation
Expressions for Real-Life Situations: Shopping for Sisters
Shopping for a resource on writing algebraic expressions? Look no further. Pupils use an interactive to drag shirts and pants out of a shopping bag. They create and evaluate an expression to represent the cost of the clothes.
CK-12 Foundation
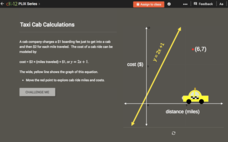
Checking Solutions to Equations: Taxi Cab Calculations
Ride to success in checking solutions to equations. Scholars use an interactive graph to identify points that are solutions to a linear equation. Interpreting these points in terms of the context completes the activity.
CK-12 Foundation
The Real Numbers: Adding Electrons
Get a charge out of a great resource! Scholars use an interactive to explore addition and subtraction of integers. They add or remove electrons in an atom model to consider its charge.
CK-12 Foundation
Seasons: Shadow Lengths
Before iPhones and calendars, how did humans determine the seasons of the year? Middle school scientists discover how to use shadows to determine the time of year in an enlightening interactive. Pupils manipulate the sun and examine the...
CK-12 Foundation
The Real Numbers: Number System
Get real about learning the real number classification. Young mathematicians create a graphic organizer of the real number system using an interactive. They answer a set of challenge questions on the classifications of real numbers.
CK-12 Foundation
Bar Graphs, Frequency Tables, and Histograms: Comparing Heights
Become a master at creating visual displays. Using a provided list of heights, users of the interactive create a bar graph and a histogram. They answer a set of challenge questions based on these data representations.
CK-12 Foundation
Graphs for Discrete and for Continuous Data: Discrete vs. Continuous Data
Not all data is the same. Using the interactive, pupils compare data represented in two different ways. The learners develop an understanding of the difference between discrete and continuous data and the different ways to represent each...
CK-12 Foundation
Double Bar Graphs: Favorite Cookies Chart
It's just the way the cookie crumbles. Using the data from a class poll, learners create a double bar graph showing favorite cookie types. The pupils compare favorites between boys and girls with the aid of their graphs, then they make...
CK-12 Foundation
Broken-Line Graphs: Heating Curve of Water
Examine the unique graphs coined broken-line graphs. Using the phase change of water for data, learners answer questions related to the temperature and energy at different times in the cycle of the phase change. Questions focus on the...
CK-12 Foundation
Line Graphs to Display Data Over Time: Strawberry Competition
Take the tediousness out of graphing. Using the interactive tool, learners can efficiently create a line graph from a set of data. They then use the graph to answer questions about specific trends in the data.
CK-12 Foundation
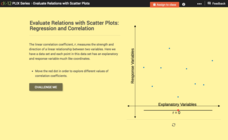
Evaluate Relations with Scatter Plots: Regression and Correlation
Introduce the concept of a correlation coefficient using an interactive lesson. Learners begin by manipulating a correlation coefficient and watching a graph change to represent the new value. Questions help strengthen their...
CK-12 Foundation
Understand and Create Stem-and-Leaf Plots: Event Survey
A good lesson doesn't just grow on trees! Help your classes understand the concept of a stem-and-leaf plot using an interactive lesson. Learners first create a stem-and-leaf plot from a set of data by dragging the values to the...
CK-12 Foundation
Stratified Random Sampling: An Extracurricular Study
Learning isn't a random process. A well-designed interactive lesson helps classes make key conclusions about stratified random sampling. They calculate group percentages and use those percentages to decide on sampling totals.
CK-12 Foundation
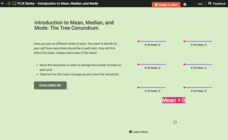
Introduction to Mean, Median, and Mode: The Tree Conundrum
How many trees should we plant? Using an interactive as a manipulative, individuals find the mean, median, and mode for sets of data. They determine the number of trees to plant in each plot of land to reach a statistical goal.
CK-12 Foundation
Formulas for Problem Solving: Finding Distance, Rate, and Time
Go the distance in learning about distance, rate, and time. Young mathematicians use an interactive to investigate the relationship between distance, rate, and time. A set of challenge questions assesses understanding of these...
CK-12 Foundation
Regular and Irregular Polygons: Polygon States
Colorado would probably object if Wyoming enlarged its borders. Scholars use an interactive map to change the borders of U.S. states to see how angles change. They then answer questions about regular and irregular polygons.
CK-12 Foundation
Properties of a Normal Distribution: Uniform Distributions
There's nothing normal about an extraordinary resource. Scholars change the dimensions of a normal distribution using a slider interactive. Determining the area under the graph gives probabilities for different situations.
CK-12 Foundation
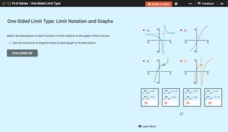
One-Sided Limit Type: Limit Notation and Graphs
A one-sided limit is no less important than a two-sided limit. Young mathematicians use an interactive to match limit notation to graphs. The exercise requires interpreting how one-sided limits connect to features of graphs.
CK-12 Foundation
Compound Interest per Period: Credit Card Payment
Credit cards can be convenient, but are they worth it? Future consumers learn about compound interest and credit card payments. They use an interactive to create a table that shows the remaining balance after each month.
