Curated OER
Data Analysis Using Technology
Analyze data using technology. Middle schoolers design data investigations, describe data, and draw their own conclusions. Then they select the best type of graph, graph and interpret the data, and look for patterns in trends. They also...
Buffalo State
A Five Day Approach to Using Technology and Manipulatives to Explore Area and Perimeter
Young mathematicians build an understanding of area and perimeter with their own two hands in a series of interactive geometry lessons. Through the use of different math manipulatives, children investigate the properties of...
Teach Engineering
Using Map Scales to Figure Distances and Areas
The asteroid is getting closer and the question is whether the state of Alabraska is large enough for the shelter calculated in the previous activity. Teams determine the scale of their project and then use the scale on the map to...
EngageNY
Comparison of Numbers Written in Scientific Notation and Interpreting Scientific Notation Using Technology
Examine numbers in scientific notation as a comparison of size. The 14th lesson plan in the series asks learners to rewrite numbers as the same power of 10 in scientific notation to make comparisons. Pupils also learn how to use a...
Curated OER
Use Google Maps to Teach Math
Capture the engagement of young mathematicians with this upper-elementary math lesson on measuring time and distance. Using Google Maps, students first measure and compare the distance and time it takes to travel between different...
Teach Engineering
Energy Perspectives
The data says ... the resource is great to use. Using Microsoft Excel, pupils analyze data from the US Department of Energy in the fifth lesson of a 25-part Energy Systems and Solutions unit. Each group looks at a different data set and...
Statistics Education Web
Saga of Survival (Using Data about Donner Party to Illustrate Descriptive Statistics)
What did gender have to do with the survival rates of the Donner Party? Using comparative box plots, classes compare the ages of the survivors and nonsurvivors. Using the same method, individuals make conclusions about the...
Council for Economic Education
Using an Excel Checkbook
High school is the time that many scholars get their first jobs. Help young entrepreneurs apply economic principles to crucial skills for their new jobs and for functioning in society in general. They use Excel to balance a checkbook by...
Teach Engineering
Can You Resist This?
Some things are hard to resist. Small collaborative groups build circuits and calculate the voltage using Ohm's Law. Budding engineers explore the connection between the voltage across different resistors and linear...
Curated OER
Using Technology to Represent Mathematical Identities
Students explore the concept of trig identities. In this trig identity lesson plan, students use Mathematica to graph trig identities. Students see the trig identities graphically and enforce the notion that two trig functions can be...
National Research Center for Career and Technical Education
Information Technology: Photoshop Scale
Scaling is a practical skill as well as a topic to be addressed throughout the Common Core math standards. You are given three different presentations and a detailed teacher's guide to use while teaching proportion, as well as practice...
Institute of Electrical and Electronics Engineers
Hand Biometrics Technology
Electronic engineering hopefuls get hands-on with hand geometry and the technology of biometrics. After taking the appropriate measurement on their hands, they configure their personal hand geometry codes and compare them to classmates....
Newspaper Association of America
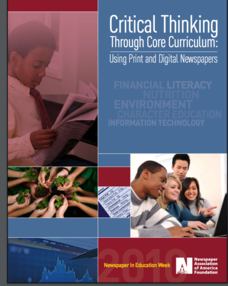
Critical Thinking through Core Curriculum: Using Print and Digital Newspapers
What is and what will be the role of newspapers in the future? Keeping this essential question in mind, class members use print, electronic, and/or web editions of newspapers, to investigate topics that include financial...
West Contra Costa Unified School District
Using Derivatives to Graph Polynomials
You can learn to graph as well as a calculator using calculus. The lesson introduces using derivatives to find critical points needed to graph polynomials. Pupils learn to find local maximums and minimums and intervals of increase...
Teach Engineering
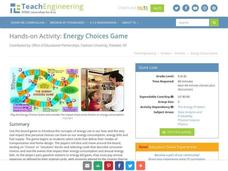
Energy Choices Game
Here's a fun game on a very serious matter. Scholars play a board game to learn about personal energy use and consumption. They see how various choices affect their energy use and costs, and then apply this knowledge to brainstorm ways...
Teach Engineering
Powering a Device Using Food
Eat up a resource on using food to power electrical devices. Future engineers first experiment with different fruits and vegetables to determine the amount of electrical energy they provide. Based on the data, they design and create an...
New York State Education Department
TASC Transition Curriculum: Workshop 2
Flipped classrooms and online tools killed the chalkboard! An awesome, hands-on technology workshop asks teachers across all content areas. to examine model lessons, become familiar with research, and explore tech tools they can...
Teach Engineering
Household Energy Audit
Do you have an energy hog in your home? Individuals pick at least one room at home to determine the amount of energy the appliances consume. Using that information, pupils fill out a worksheet to determine the cost of running each...
Teach Engineering
Energy in Our Lives Carousel
Don't waste any more energy trying to find a great resource on energy. The third installment of a 25-part Energy Systems and Solutions unit focuses on energy use in pupils' lives. They consider how their daily routines consume energy and...
Institute of Electrical and Electronics Engineers
A Question of Balance
It's a neat idea, but the task of designing a system for filling jars with consistent specific amounts of a product may be a little out of reach, especially for younger pupils. Intended as an engineering design lesson, this may be better...
Teach Engineering
Spring Away!
The last segment of the nine-part unit makes a connection between springs and linear equations. Groups hang weights from the spring and measure its length. Then, using the data collected, they calculate the slope to find the k-value...
Howard Hughes Medical Institute
Spreadsheet Tutorial 3: Column Graphs, Error Bars, and Standard Error of the Mean
There's absolutely no error in using the tutorial! Learners use spreadsheets to create column or bar graphs with error bars. They also learn how to calculate the standard error of the mean in the tutorial. This is the third installment...
Curated OER
Teaching Polygons using Technology
Third graders utilize different types of computer programs, such as Microsoft paint and Microsoft Word to study and create different types of polygons. They use PowerPoint to create a story about a shape and others that it meets during a...
Curated OER
Using Technology To Teach Parallel Lines With Transversals
Students explore the relationships between angles formed by two lines cut by a transversal when lines are and are not parallel. They define key vocabulary terms, then using a camera take pictures at their school of parallel lines with...
Other popular searches
- Biography Using Technology
- Making Maps Using Technology
- Math Using Technology
- Lesson Plans Using Technology
- Writing Using Technology
- Math Lessons Using Technology
- Poetry Using Technology
- Lesson Plan Using Technology
- Science Using Technology
- Language Arts Using Technology
- Measurement Using Technology
- Book Reports Using Technology


