Curated OER
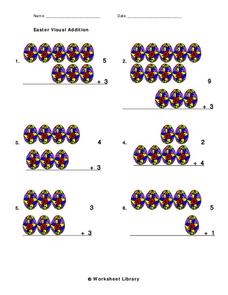
Easter Visual Addition
A colorful display of Easter eggs will aid young mathematicians in solving 6 problems. They are required to solve each of the 1-digit equations using counters, or in this case, Easter eggs. An answer key is also provided.
National Security Agency
Starting a Restaurant
Through an engaging unit, chefs-in-training will sort and classify data using tally charts. Learners will also create bar graphs to display restaurant data and interpret data from bar graphs using a variety of categories....
West Contra Costa Unified School District
Comparing Data Displays
There is so much more to data than just numbers, and this resource has learners use three methods of comparing data in a multi-faceted lesson plan. The 21-page packet includes a warm-up, examples, an activity, and assessment for a...
Concord Consortium
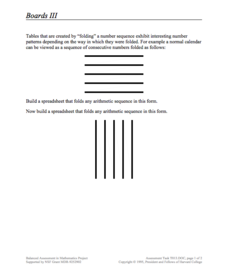
Boards III
Learn to visualize mathematical patterns as a folded pattern. Beginning with a visual display, the task encourages pupils to view sequences as a folded table. The pattern of the table then becomes a formula in a spreadsheet that...
Curated OER
Dividing by 10
Use money to help scholars understand dividing by 10. They examine a visual displaying one dollar as equivalent to 10 dimes. Then, learners examine sets of 10 dimes to determine how many dollars are represented in each problem. One is...
Curated OER
Fast Talker - Ch 2 project
Tongue Twisters?! Create scatter plot graphs based on timing fellow classmates saying tongue twisters. Then investigate, display, and analyze the relationships based on functions. Wrap up this activity by making a...
Illustrative Mathematics
Cell Phone Plans
Turn your classroom into a local cell phone store. Then, have your cell phone agents use linear equations to visually display three cell plans and their advantages. It makes for a great group project. Discuss how to decide which plan is...
Curated OER
Positive Future Fair Project
Ninth graders view the film "Pay It Forward" and discuss what kind of public campaign is needed to move people to positive action. They consider different ways of presenting information (graphs, visual displays, etc.) as tools for...
Virginia Department of Education
Numbers in a Name
What's in a name? Pupils create a data set from the number of letters in the names of classmates. Each group then takes the data and creates a visual representation, such as a histogram, circle graph, stem-and-leaf plot, etc.
Perkins School for the Blind
One-to-One Correspondence
Here is an interesting way to build concept understanding regarding one-to-one correspondence. Learners with visual impairments will use an array of everyday objects in context to foster an understanding of what one-to-one correspondence...
Concord Consortium
Graphing Elements
How do you graph a sentence? Scholars do just that as they represent relationships between independent and dependent variables with a graphical representation. Given a sentence, they determine the pertinent relationship and create a...
Curated OER
Writing Numbers
How many letters? Budding counters determine and record the number of letters in five messages trailing behind planes. The write down both the numeral and the word form; the highest number here is 19. Next, pupils fill in two blank...
CK-12 Foundation
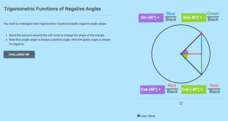
Trigonometric Functions of Negative Angles
When is the trigonometric value of a negative angle the same as the positive angle? Pupils compare the values of trigonometric functions for different angles and their negatives. The interactive resource provides a visual display to make...
CK-12 Foundation
Bar Graphs, Frequency Tables, and Histograms: Comparing Heights
Become a master at creating visual displays. Using a provided list of heights, users of the interactive create a bar graph and a histogram. They answer a set of challenge questions based on these data representations.
Curated OER
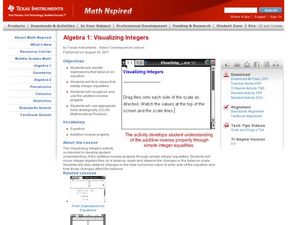
Visualizing Integers
Students create visuals on the TI Calculator to solve problems. In this algebra instructional activity, students perform basic operations with integers. They add, subtract, multiply and divide.
CoreCommonStandards.com
Common Core State Standards: Second Grade Workbook
You've hit the second grade Common Core jackpot! Find over 40 pages of curriculum designed specifically for the standards, both math and language arts. Printable versions of each standard can be used as learning displays, and...
Curated OER
Division Word Problems
How many pencils did each student get? Learners read this and two more division scenarios accompanied by helpful visuals. The problems involve very direct division operations, and all answers are whole numbers. If you project this as an...
Curated OER
One More/One Less Scoop
It's so simple: scoop a spoonful of counters, count them, and then make a set that is one more than that number. Next, make a set that is one less. The tangible nature of this basic addition and subtraction activity will keep learners...
EngageNY
The Relationship Between Visual Fraction Models and Equations
Ours is to wonder why, not just to invert and multiply. The seventh installment of a 21-part module uses fraction models to help pupils understand why the invert-and-multiply strategy for dividing fractions works. They then work on some...
K-5 Math Teaching Resources
Small Five Frames with Dots
Working on adding and subtracting small numbers? Introduce five frames with a resource that visually supports your mathematicians' growing proficiency with counting strategies.
Google
Code for Equality
It's my belief that all learners should have equal access to computer science projects! Young computer scientists learn about variables, encapsulation, sequences, and objects in block-based coding. They create a collage by first...
CK-12 Foundation
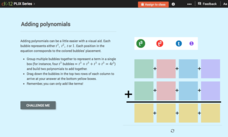
Addition and Subtraction of Polynomials: Adding Polynomials
Stack the like terms to add vertically. The resource contains a visual aid to help with the addition of polynomials using the vertical method. Pupils use the aid to calculate the sum of two polynomials.
Curated OER
Percents: What's the Use
Students research percentages in real world situations. In this percents instructional activity, students demonstrate their ability to apply percents to everyday situations. Students communicate mathematically by conducting interviews...
Center for Innovation in Education
Unifix Cubes
Support young mathematicians with building a strong foundational number-sense using this series of printable Unifix® cube strips. Adaptable to the teaching of a variety of different concepts, from basic counting and cardinality, to...
