Curated OER
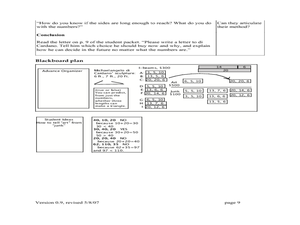
Art or Junk? Discovering the Triangle Inequality
Middle schoolers study the triangle inequality. They will identify, compare, and analyze attributes of two and three-dimensional shapes. Then they develop vocabulary to describe the attributes. They also use manipulatives to analyze the...
Curated OER
Water Cycle
Young scientists explore Earth elements by conducting an experiment. They define water vocabulary terms such as condensation and precipitation. In addition, they conduct a water experiment in which they build a terrarium, so they can...
Curated OER
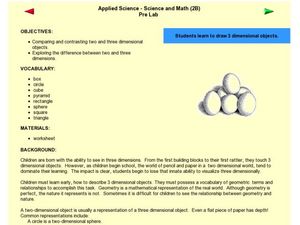
Draw 3 Dimensional Objects
Bring three-dimensional shapes to life in your classroom. First introduce the vocabulary of three-dimensional shapes, such as sphere, cube, and pyramid. Then, show your kids examples of how to use two-dimensional objects draw...
Curated OER
Where Am I, and How Do I Get Where I am Going?
Students describe geographical places through art, music, writing, and math. They compile information in booklets which may be published.
PBS
Surface Area and Volume
You and your class will like this lesson on using visual models to relate the volume and surface area of solid shapes. Learners construct three-dimensional forms using nets. They calculate the surface area and volume for each and then...
Jordan School District
Picture Frames and Algebra
Middle schoolers create a method for finding the area of a fame for a picture and then transfer their shared methods into algebraic expressions. They develop the algebraic language to communicate and solve problems effectively and...
Utah Education Network (UEN)
The Distributive Property For Numerical and Variable Expressions
Collaborate to research and share. Doesn't that sound great? Learners explore algebraic expressions, use Algeblocks to examine and compare numerical and variable expressions, and apply the distributive property. Examples and worksheets...
Curated OER
Design Space
Students will develop an understanding design space. The arrangement of shapes is taught to create simple perspective. The differences in the size of shapes is shown in order to help learners see how they should be arranged in...
Curated OER
Exploring the Hudson in 1609
While this instructional activity focuses on a study of the Hudson River, it could be used as a template for a discussion of map skills, converting measurements, and plotting a route. The instructional activity includes vocabulary and...
Curated OER
The Formation of Fossil Fuels
Learners participate in an activity in which they explain the difference between renewable and nonrenewable sources of energy. They discover why the supply of fossil fuels is limited and practice using new vocabulary.
Curated OER
Mean Absolute Deviation in Dot Plots
The lesson focuses on the ideas of dot plot representations and the mean absolute deviation of data sets.
California Department of Education
I Have “M.I.” Strengths!
There are so many ways to be smart! Can your class identify their intelligences? The third of five career and college lesson plans designed for sixth graders challenges them to assess their unique skills. Once they determine their...
Curated OER
ESL Vocabulary Lesson Plan - Opposites for Beginners
Students work on vocabulary lesson plans.
Curated OER
Telling Time
Students tell time. In this ELL vocabulary development and math lesson, students orally tell time to five minute intervals when shown a classroom clock. Students practice using number and "telling time" vocabulary in sentences and...
EngageNY
Construct an Equilateral Triangle (part 1)
Drawing circles isn't the only thing compasses are good for. In this first installment of a 36-part series, high schoolers learn how to draw equilateral triangles by investigating real-world situations, such as finding the location of a...
Illustrative Mathematics
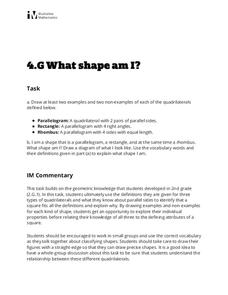
What Shape Am I?
Sharpen your pencil and grab a ruler, it's time to draw some quadrilaterals! Given the definition of a parallelogram, rectangle, and rhombus, learners draw examples and nonexamples of each figure. The three definitions are...
EngageNY
Margin of Error When Estimating a Population Mean (part 1)
We know that sample data varies — it's time to quantify that variability! After calculating a sample mean, pupils calculate the margin of error. They repeat the process with a greater number of sample means and compare the results.
EngageNY
Copy and Bisect an Angle
More constructions! In this third installment of a 36-part series, learners watch a YouTube video on creating door trim to see how to bisect an angle. They then investigate how to copy an angle by ordering a given list of steps.
EngageNY
The Graph of a Function
Mathematics set notation can be represented through a computer program loop. Making the connection to a computer program loop helps pupils see the process that set notation describes. The activity allows for different types domain and...
National Security Agency
Classifying Triangles
Building on young mathematicians' prior knowledge of three-sided shapes, this lesson series explores the defining characteristics of different types of triangles. Starting with a shared reading of the children's book The Greedy...
Bowland
DanceStar
Express dance moves mathematically. Scholars dissect dance routines and express them using mathematical notation, such as translations and rotations. They use video clips to investigate seven different dance genres.
EngageNY
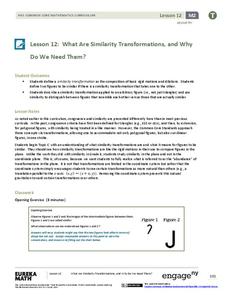
What Are Similarity Transformations, and Why Do We Need Them?
It's time for your young artists to shine! Learners examine images to determine possible similarity transformations. They then provide a sequence of transformations that map one image to the next, or give an explanation why it is...
EngageNY
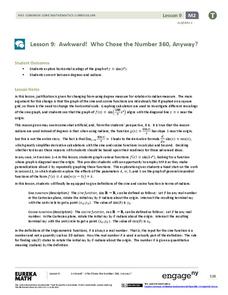
Awkward! Who Chose the Number 360, Anyway?
Don't give your classes the third degree. Use radians instead! While working with degrees, learners find that they are not efficient and explore radians as an alternative. They convert between the two measures and use radians with the...
EngageNY
Calculating Probabilities of Events Using Two-Way Tables
Tables are useful for more than just eating. Learners use tables to organize data and calculate probabilities and conditional probabilities.
