Curated OER
Spreadsheets in Science
Fourth graders create spreadsheets, explore patterns and make predictions based on the information. They select the appropriate graph to display the spreadsheet data. They search and sort prepared data bases to gain knowledge for...
Curated OER
Farming: Raising Winter Wheat (Lesson 3)
Students identify foods that are made from wheat. They use a line graph to explain measurement. They identify foods from the food groups and explain how temperature, prefcipitation and natural resources affect the growth of wheat.
Curated OER
Seasons' Journey: As the World Turns
Fourth graders explore the earth's revolution around the sun and the changes in weather that follow this motion.
Curated OER
Cloud Discovery
Students create a HyperStudio stack that describes and illustrates twelve different kinds of clouds. They then make inferences about which types of weather the different types of clouds could help predict.
Curated OER
Blowing in the Wind
Students compare hurricanes and tornadoes. They write a paragraph explaining how to prepare for a storm. Students give an oral report. They use weather facts to practice math skills. Students record observations of a storm.
Curated OER
Rain Drops Keep Falin' On My Drainage Basin
Students compile information about rainfall, lake elevations and releases of water from Tuttle Creek reservoir into maps, graphs and charts.
Curated OER
What is a Cloud
Third graders study clouds and how they are formed. They write acrostic poems about clouds and analyze and graph temperature data collected during varying degrees of cloud cover.
Curated OER
"Across Oregon On The 45th N Parallel" A Transect of Oregon
Students explore the physical geography of Oregon. In groups, students collect weather and elevation information on Oregon. They organize the data and create maps and graphs of the information. Afterward, students compare the...
Curated OER
Comparing Temperatures of US REgions
Third graders explore regional factors that affect daily temperature. They collect data on three cities in the northeast, southeast and midwest regions of the US for two weeks. The Weather Channel website is used each day to collect...
Curated OER
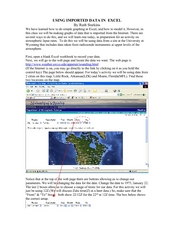
Using Imported Data in Excel
Young scholars import atmospheric data from the internet. In this earth science lesson plan, students graph the data they collected. They complete the worksheet after the activity.
Curated OER
Using SWMP Data
Students are introduced to the SWMP system which tracks short-and long-term changes in water. Using this data, they plot and interpret the data on a graph to determine how human activities are lowering the water quality. They also...
Curated OER
Science: Trouble in the Troposphere
Students research a NASA Website and record information about an assigned city's tropospheric ozone residual monthly climate. In groups, they graph the information for the past year. They form new groups and compare their city's...
Curated OER
CSI Clamshell Investigation
Students explore predator/prey relationships. They research information on moon snails and claims. Students draw conclusions from the data collected. They use math and graphing to determine if there is a relationship to the clam's size...
Curated OER
Why Here? Why Not There?
Students analyze a map and graph information on eleven countries. Using the characteristics of the countries, they determine if they should host the summer or winter Olympic games. After viewing a video, they locate the latitudes of...
Curated OER
Effects of Ozone in the Air
Fifth graders learn how ground-level ozone is an air pollution problem. Students measure ozone levels and graph the results.
Curated OER
CURRENT AND CLIMATE
Students study currents and how they have been used to plot courses for travel. They examine the ocean currents in both the Atlantic and Pacific and discuss their effect on local weather.
Curated OER
Korea Cultural Lesson Plan
Students engage in a study of geography and maps of Korea. They examine charts and graphs. Students are expected to interpret the information accurately and completely. The geography skills can be used on other countries as well.
Curated OER
The Window
Students read a story entitled, "The Window," and discover how some cultures are rejected by others. Students write a letter expressing feelings of rejection and keep a journal of significant events in the story. Using a graphic...
Curated OER
Cloud Discovery
Students create a slideshow that pictorially depicts a variety of cloud types. They research clouds, develop and present the slideshow and then evaluate their efforts based on a rubric for self-evaluation.
Curated OER
Class Final Report - Global Sun Temperature Project
Students reflect on the data they have analyzed during the Global Sun Temperature Project. They use the project website as a resource for their observations, draft a class report and post it on the Internet.
Curated OER
Predicting Monthly Precipitation
Students should log onto, and collect data from, a specific site on the Internet. They average and compare the data using the Excel spreadsheet program, make predictions from their data, and determine the percent error of their predictions.
Curated OER
Water 1: Water and Ice
Learners examine the changes as water goes from solid to liquid. In this states of matter lesson plan, students observe and record the changes to water as it changes from solid to liquid and back to solid.
Curated OER
Heating the Atmosphere
Students construct a thermograph for maximum and minimum temperatures for the 2-week period. They illustrate how the earth's atmosphere is heated by convection and conduction currents and evaporation of water.
Rainforest Alliance
Climate Educator Guide
Climate change is a hot topic in the news. Class members examine carbon dioxide data to analyze trends of our atmospheric makeup over time. They also discuss climate and climate change, and determine how these changes are affecting life...
Other popular searches
- Graphing Weather
- Graphing Weather Data
- Graphing Weather Activity
- Graphing the Weather
- Weather Graphing Temperature
- Weather Graphing Probability

