Curated OER
Linear Programming
Learners explore inequalities to determine the optimal solution to maximize a profit for a company. In this linear programming lesson, students discover how to graph inequalities and how to determine the algebraic representation of a...
Curriculum Corner
8th Grade Math Common Core Checklist
Ensure your eighth graders get the most out of their math education with this series of Common Core checklists. Rewriting each standard as an "I can" statement, this resource helps teachers keep a record of when each standard was taught,...
Freecloud Design
Mathmateer
Three, two, one...liftoff! Elevate math skills to new heights while having a blast. A great resource that combines entertainment and education for children of all ages.
Rational Number Project
Initial Fraction Ideas Lesson 9 Overview
Visual models support young mathematicians with exploring equivalent fractions. Starting with a quick warm-up problem, children go on to work through a series of guiding practice problems before working with a partner identifying and...
Curated OER
Algebra 2 Desmos Graphing Project
Encourage class members to get creative with functions. Pairs write their names and draw pictures using a graphing application with a collaborative graphic project. The resource provides the requirements for the project, as well as a...
EngageNY
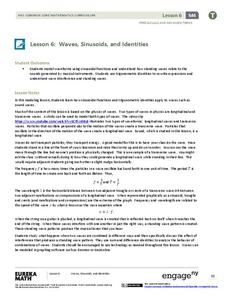
Waves, Sinusoids, and Identities
What is the net effect when two waves interfere with each other? The lesson plan answers this question by helping the class visualize waves through graphing. Pupils graph individual waves and determine the effect of the interference...
Kenan Fellows
Algebra I Review, Solving for Unknown Variable
Many high school science courses rely on mastery of algebra skills. In an integrated chemistry and Algebra II lesson scholars review solving equations for a specified variable with a worksheet. They use common chemistry equations to...
Mrs. Burke's Math Page
Let Them Eat Pi
Looking for a fun and creative way to celebrate Pi Day? Then this is the resource for you. From a scavenger hunt and trivia contest to PowerPoint presentations and skills practice worksheets, this collection of materials is a...
Balanced Assessment
Getting Closer
Flip the script! Reverse the situation and ask the class to find the function given asymptotes. The task requires class members to use their knowledge of functions and asymptotes to create functions that have a given asymptote or...
BW Walch
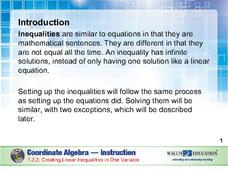
Creating Linear Inequalities in One Variable
Just when a young mathematician starts to feel comfortable turning word problems into linear equations, shake things up and throw inequalities in the mix. This excellent, instructive presentation takes the steps for solving an equality...
Statistics Education Web
It Creeps. It Crawls. Watch Out For The Blob!
How do you find the area of an irregular shape? Class members calculate the area of an irregular shape by finding the area of a random sampling of the shape. Individuals then utilize a confidence interval to improve accuracy and use a...
CK-12 Foundation
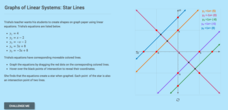
Graphs of Linear Systems: Star Lines
Let the class stars shine. Using four given linear equations, scholars create a graph of a star. The pupils use the interactive to graph the linear systems and determine the points of intersection. Through the activity, classmates...
Curated OER
Using Computer for Statistical Analysis
High schoolers use the computer and S'COOL data for statistical analysis.
Curated OER
Building Understanding of Rate of Change/Slopes Using Alice
Students explore slope as a rate of change. In this eighth grade mathematics lesson, students investigate real-world problems to determine rate of change and transform it into a linear representation, thus determining slope. Students...
Curated OER
Poolroom Math
Students identify, name, and measure angles using playing pool as a motivator in this lesson. They measure, define, and label different angles. They then discuss how their knowledge about angles could be used in a game of pool.
Teach Engineering
Ranking the Rocks for Desired Properties
Math rocks! Cavern design teams determine the rankings of rock types based upon desirability points. The points are connected to the properties of the rocks and their usefulness in building a cavern.
Teach Engineering
Protecting Our City with Levees
Teams use the design process to design, build, and test a model levee to protect the town from a wall of water. A handout provides a price list for the materials learners can use to build their levee within a budget.
Teach Engineering
Design and Build a Rube Goldberg
Let's see how complicated we can make this simple task. The last activity associated with a 10-part series has groups design and build a Rube Goldberg machine. Teams determine a simple task to accomplish and use the engineering design...
Teach Engineering
Maximum Power Point
Investigate the maximum power output of a photovoltaic panel with a lesson that introduces the class to the maximum power point. Individuals learn how to determine the maximum power point of a solar panel by using Ohm's law and the power...
Teach Engineering
Household Energy Audit
Do you have an energy hog in your home? Individuals pick at least one room at home to determine the amount of energy the appliances consume. Using that information, pupils fill out a worksheet to determine the cost of running each...
Balanced Assessment
Cost of Living
Math scholars investigate the cost of living in Hong Kong compared to Chicago but must first convert the different types of currency. They then choose a type of graph to compare different spending categories and finish the activity by...
Gatton Park
Magical Maths
A variety of activities take scholars outside the classroom to explore shapes, symmetry, measurement, patterns, sorting, and time in nature. Learners participate individually, and in teams, to measure found objects, go on a scavenger...
Code.org
Making Data Visualizations
Relax ... now visualize the data. Introduce pupils to creating charts from a single data set. Using chart tools included in spreadsheet programs class members create data visualizations that display data. The activity encourages...
Statistics Education Web
The United States of Obesity
Mississippi has both the highest obesity and poverty rate in the US. Does the rest of the data show a correlation between the poverty and obesity rate in a state? Learners tackle this question as they practice their skills of regression....


