TED-Ed
Four Ways to Understand the Earth's Age
Cartoon children compare the earth's age to timescales that we understand:a calendar year, the thickness of a book, the human lifespan. This smart film clip is definitely worth adding to your geologic timescale lesson! If you subscribe...
Flipped Math
Modeling with Graphs
Create a graph for anything in the world. Pupils continue to work with graphs that model situations. The learners analyze different graphs to answer questions about the scenario along with finding equations of graphs. Scholars use...
Flipped Math
Create and Analyze Graphs
Model the world with graphs. Pupils watch and participate in creating graphs to model real-world situations. The presenters stress the importance of a consistent scale and proper labels for the graphs along with identification of the...
Corbett Maths
Density
A short video introduces the triangle that illustrates how to find any value given the other two in the density formula. Class members use the triangle to work several problems to find the mass, volume, or density of an object.
Corbett Maths
Pressure
Do not let the pressure get to you. After watching a video on calculating values using the pressure formula, pupils work problems on two worksheets. The problems range from finding the pressure, the force, or the area given the other two...
Corbett Maths
Conversion Graphs
Add a new method of converting units to your repertoire! A video lesson describes how to use a graph to convert units. The lesson focuses on miles-to-kilometers and kilometers-to-miles conversions but applies to any type of conversion.
Mathispower4u
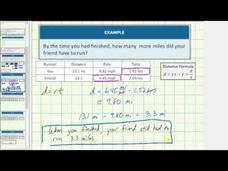
Problem Solving Using Distance, Rate, Time (Running)
Go the extra mile to learn about distance. Scholars learn to apply the distance, rate, and time formula by watching a short YouTube video. The narrator of the video works through several examples using running contexts.
National Science Foundation
Mathletes—Science of the Winter Olympics
Investigate the mathematics of the Olympics. A science video how mathematics is important from the basic level of calculating scores to the more complex math of describing the velocity of motion. Scholars learn to view Olympic...
3Blue1Brown
Vectors, What Even Are They? | Essence of Linear Algebra, Chapter 1
Take a look at vectors as geometric objects and then as an algebraic concept. The second video in a series of 15 introduces the vector using three perspectives: the physics, computer science, and mathematical. The resource shows the...
NASA
Introduction to Real Air Traffic Control—Problem Set A
Understand what it takes to control planes safely. The first lesson in a series of six introduces the class to the air traffic control situation. The pupils develop their understanding of units used in air travel, then learn how to read...
Teach Engineering
Microfluidic Devices and Flow Rate
When you have to flow, you have to flow. The lesson introduces class members to microfluidic devices and their uses in medicine. They watch a short video on how the diameter affects the rate of flow. The worksheet has individuals...
Northeast Arkansas Education Cooperative
Scatter Plots
Show learners how to plot data to determine correlation. A data analysis video gives examples of positive, negative, and no correlation between variables. The final example plots real-life data, provides a line of best fit, and...
TED-Ed
How to Think About Gravity
What goes up must come down, but there is more to the phenomenon than meets the eye! As it turns out, any two objects attract to each other. The formula for Newton's law of universal gravitation is introduced in the explanation. A touch...
National Education Association
Scatter Plots and Line of Best Fit
Demonstrate how to use a box and whisker plot to place a line of best fit accurately with an educational video. It begins with a review of box and whisker and line of best fit, and then uses an application problem to describe the...
Varsity Tutors
Varsity Tutors: Hotmath: Graphing Calculator Practice Problems: Statistics
Practice using your graphing calculator for statistics problems, including displaying and interpreting data. If you get stumped or if you would like to check your work, then select the View Solution button, which is located directly...
Sophia Learning
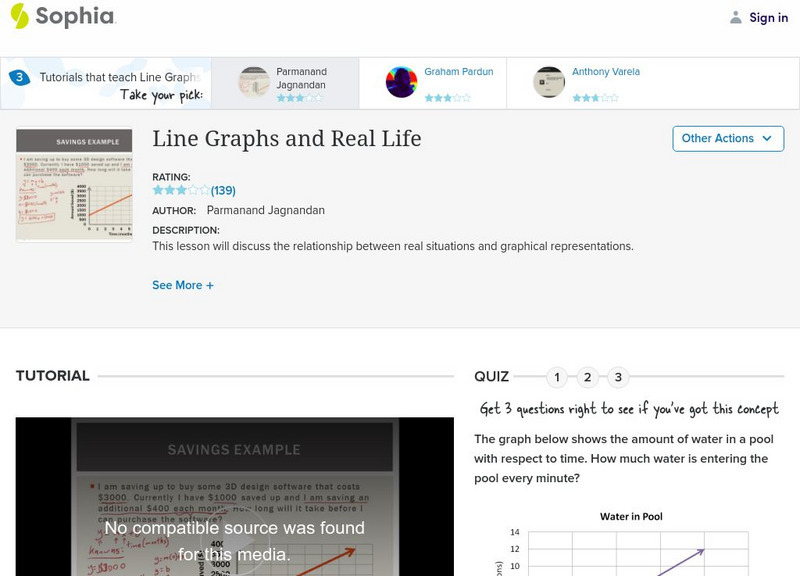
Sophia: Line Graphs and Real Life
This video lesson demonstrates how to create a line graph to solve two real world math problems.
Khan Academy
Khan Academy: Graphing Solutions to Equations: Interpreting Linear Graphs
This video demonstrates real-life situations that might result in a linear relationship and shows what this relationship would look like on a graph.


