NOAA
Ocean Exploration
Sea explorers and scientists have found that because of temperatures being two to three degrees Celsius at the bottom of the ocean, most animals are lethargic in order to conserve energy. In this web quest, pairs of learners read about...
Polar Trec
What Can We Learn from Sediments?
Varve: a deposit of cyclical sediments that help scientists determine historical climates. Individuals analyze the topography of a region and then study varve datasets from the same area. Using this information, they determine the...
Polar Trec
Down to the Deep Virtual Lab
At a depth of 3,000 m in the ocean, the pressure is 300 times that at sea level! In the activity, individuals predict what will happen to Styrofoam cups submerged 3,000 meters into the ocean. They then convert these units to soccer...
Polar Trec
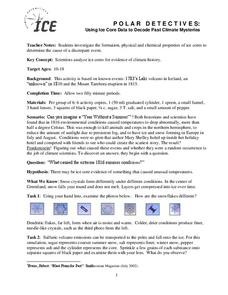
Polar Detectives: Using Ice Core Data to Decode Past Climate Mysteries
How does examining an ice core tell us about weather? Learners set up and explore fake ice cores made of sugar, salt, and ash to represent historical snowfall and volcanic eruptions. From their setups, scholars determine what caused the...
NOAA
Tracking a Drifter
Be shore to use this drifter resource. The third installment of a five-part series has learners using the NOAA's Adopt-a-Drifter website to track to movement of a drifter (buoy) in the ocean. Graphing the collected data on a map allows...
University of Chicago
Don't Be Too Flaky
Snow, ice, and water are all composed of H2O. Does that mean they all have the same volume? Discover the ways that the densities of these substances determine their volumes, and how they change based on their current states of matter....
National Energy Education Development Project
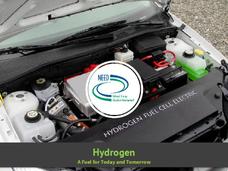
Introduction to Hydrogen
Every region has a renewable resource that can be used to make hydrogen. But, what is hydrogen and why can it be used as an energy source? Find out with a presentation that answers these questions and then discusses where hydrogen is...
National Energy Education Development Project
Introduction to Solar Energy
People have been using solar energy for many generations to dry crops, heat homes, and for light. This presentation explains how now it is possible to capture the solar energy and store it for future use, details how and where people use...
National Energy Education Development Project
The Science of Energy
Did you know the word energy comes from energeia, a Greek word? Introduce learners to the four types of potential energy, five types of kinetic energy, and energy transformation with a presentation about where we get our energy and how...
National Energy Education Development Project
Exploring Nuclear Energy
Every 18–24 months, nuclear power plants shut down to remove their used uranium fuel, a radioactive waste. Show learners how energy is made and used around the world and then focus on the United States' usage. Viewers then specifically...
National Energy Education Development Project
Energy Works: Yes, Indeed it Does!
Moving from its definition to how it moves and its different types, scholars see different examples and then move into its application and use in everyday lives, in an energy-based presentation.
Rainforest Alliance
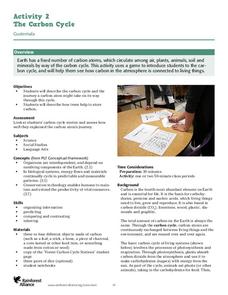
The Carbon Cycle
Scholars learn about the carbon cycle, play a carbon cycle game, and then write a story based on their role as a carbon atom during the game. After the writings, pupils analyze the carbon cycle by leading a class discussion on the material.
National Energy Education Development Project
Exploring Hydropower
In 2006, about 20 percent of the world's electricity was generated from hydroelectric power. In the presentation, scholars review the water cycle and gravitational energy to begin to understand how humans harness the power of water. They...
National Energy Education Development Project
Exploring Oil and Gas
The United States consumes more oil than any other country, about 1.85 billion barrels (or 77 billion gallons) a day. Viewers learn about the history of fossil fuel exploration and how they are formed in an informative presentation. They...
National Energy Education Development Project
Great Energy Debate
If someone yelled for eight years and eight months, they could produce enough energy to heat one cup of coffee. A lesson on energy encourages scholars to research 10 different energy sources in groups before playing a game. Twenty...
University of Texas
Observing the Moon
Why does it look like there is a man on the moon? Why does the moon look different every night? These are the focus questions of a lesson that prompts class members to observe and record the nightly changes of Earth's natural satellite.
National Energy Education Development Project
Exploring Transportation
Did you know horsepower is actually based on the power of a horse? 60 horse power is the equivalent of being pulled by a team of 60 horses! Viewers will learn other interesting facts like this from a presentation that begins with the...
NOAA
Ground-truthing Satellite Imagery with Drifting Buoy Data
Ground-truthing ... is it even a word? The last installment of a five-part series analyzes how scientists collect sea surface temperature data. Scholars use government websites to compare temperature data collected directly from buoys...
NOAA
Graphing Temperatures
Battle of the hemispheres? In the fourth installment of a five-part series, young oceanographers use the NOAA website to collect temperature data from drifters (buoys), one in the Northern Hemisphere and one in the Southern Hemisphere....
NOAA
Climographs
In the second lesson of a five-part series, young climatologists use provided temperature and precipitation data to create climographs of three different cities. They then analyze these climographs to develop a general understanding of...
NOAA
A Laboratory Simulation of Ocean Surface Currents
Stimulate interest in ocean currents with a simulation. The first installment of a five-part middle school series teaches future oceanographers about the forces that interact to cause ocean currents. A simulation shows how wind and the...
Energy for Keeps
The Energy Times
Extra! Extra! Read all about past and present energy use in a classroom-made historical newspaper. Useful as a cross-curricular assignment between science, history, and language arts, the project is sure to get young journalists...
Teach Engineering
Recommendations and Presentations: Drum Roll Please
Teams analyze the data they collected during the past six lessons and finalize where they will build a survival cavern. They then present their decisions to the rest of the class and justify their locations.
Teach Engineering
Incoming Asteroid! What's the Problem?
Oh, no! An asteroid is on a collision course with Earth!. Class members must rise to the challenge of designing a shelter that will protect people from the impact and permit them to live in this shelter for one year. In this first lesson...


