Education World
Predicting Pumpkins
If you want more pumpkin seeds, you should get a bigger pumpkin—right? Young harvesters use estimation skills to make a hypothesis about how many seeds they will find in a pumpkin before examining the real number inside.
Curated OER
Fuel Cell Experimentation
With rising oil prices and increasing concerns over global warming, the pressure is on for engineers to develop alternative sources of energy. Among the new technologies being developed are hydrogen fuel cells, which young scientists...
Commonwealth of Pennsylvania
Density Worksheet
Find the mass, volume, and density in five different equations with a straightforward worksheet. Each equation prompts kids to work through word problems of varying difficulty and to find the necessary measurement using different formulas.
San Francisco Public Utilities Commission
Water from the Well
How much water does it take to brush your teeth? How about to wash your clothes? Perform an experiment that measures water usage in everyday tasks and compares them to the days before indoor plumbing, specifically the California...
Polar Trec
Ozone Data Comparison over the South Pole
Did you know the hole in the ozone is seasonal and filled by January every year? The lesson uses scientific measurements of the ozone over the South Pole to understand patterns. Scholars learn that the hole grew bigger annually before...
Polar Trec
Nature's Density Column
Nature provides density columns in the polar regions that provides food for many animals. Young scientists build their own density columns with water in order to answer analysis questions. Through a slideshow presentation, scholars...
101 Questions
Speed of Light
How quickly does light travel long distances? A short video simulates light going from the earth to the moon at two different paces. Scholars relate the distance to the rate to understand which simulation is correct.
NOAA
Investigating Sea Level Using Real Data
The news reports on rising sea level, but how do scientists measure this rise? Scholars use NOAA data including maps, apps, and images to work through five levels of activities related to sea level. Each level in the series adds a new...
Disney
Where Do Brown Bears Live?
What do brown bears in Alaska's Katmai National Park need to survive? Pupils explore the unique habitats, diet, and survival needs of this animal. They predict the consequences of removing any integral part of the bear's survival,...
Longwood University
How Can We Help Maintain Our Water Supply? Conserving Water
Make young citizens aware of their environmental impact early. An inquiry-based lesson helps learners analyze their own water usage patterns and understand the effects of their habits. Individuals look at data to spot trends and see how...
Las Cumbres Observatory
Plotting an Asteroid Light Curve
Data can tell us a lot about celestial objects that are just too far away to study otherwise. Learners examine data on the brightness of an asteroid to predict its rotation rate. Graphing the data reveals a periodic pattern that allows...
Minnesota Department of Natural Resoures
Minnesota’s Forests
The forests of Minnesota provide middle schoolers with an integrated learning opportunity. They examine the three biomes and their histories, conduct experiments, read stories, and draw pictures. A lovely lesson about trees.
Sea World
Seals, Sea Lions, and Walruses
Learn about the mammals of the sea with a lesson about seals, sea lions, and walruses. Kids study the characteristics of each pinniped with flash cards and information, and then analyze data about elephant seals, measure heat loss...
Mathematics Assessment Project
Temperatures
As a middle school assessment task, learners first examine line graphs of monthly temperatures for two locations, and then match box plots to each line plot.
Polar Trec
How Much Data is Enough?
The next time you read a magazine or watch the news, make note of how many graphs you see because they are everywhere! Here, scholars collect, enter, and graph data using computers. The graphs are then analyzed to aid in discussion of...
Indiana Department of Education
The Represented World: Communication—Packaging
Challenge your classes to design and market a new product. Collaborative groups use geometry skills to create packaging for their products. Finally, they plan a marketing strategy to present to a marketing specialist.
101 Questions
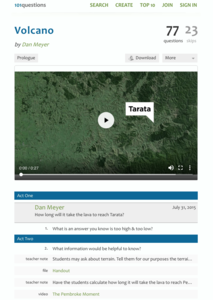
Volcano
This resource will blow your mind! Young mathematicians estimate the rate of volcanic lava flow by watching a video. They apply the rate formula to determine how long it would take the lava to reach a city. Let's hope everyone gets out...
Beyond Benign
Intended Occupants
Here's a lesson you can really build on! Middle schoolers describe the occupants of an imaginary house during a character-building lesson. They create a cast of characters who share living space and provide details about their attitudes,...
Balanced Assessment
Solar Elements
Let your brilliance shine like the sun. Future mathematicians and scientists consider given data on the abundance of different elements in the sun. The assessment task requires consideration of how these different abundances relate to...
CK-12 Foundation
The Real Numbers: Adding Electrons
Get a charge out of a great resource! Scholars use an interactive to explore addition and subtraction of integers. They add or remove electrons in an atom model to consider its charge.
Purdue University
Plastic Water Bottle Design – What’s the Best Shape?
Join the fight to reduce plastic waste. A hands-on STEM activity first teaches scholars about the scourge of plastic waste. They then measure the dimensions of water bottles to calculate surface areas and volumes before using the surface...
Las Cumbres Observatory
Plotting a Supernova Light curve
Supernovas burn for a short time but can give scientists extensive information about the universe. Learners analyze given data about the change in the light magnitude of a supernova. They look for patterns in the data and use them to...
Curated OER
The Disappearing Honeybees: Tracking Honeybee Decline
Students practice graphing and other math skills to track number of honeybee colonies present in United States since 1978, discuss major crops that are dependent on insect pollinators, and examine reasons for decline of United States...
Curated OER
Navigating by the Numbers
Students observe how math is important in navigation and engineering. They study how surveyors use math and science to calcute, count, measure, label, and indicate distances on a map. They estimate specific distances.
Other popular searches
- Math and Science
- Math and Science Careers
- Integrated Math and Science
- Science/ Math Games
- Math and Science Activities
- Integrating Math and Science
- +Math and Science Careers
- Math and Science Plan
- Math in Science
- Math Science
- Math and Science Lessons
- Math and Forensic Science


