Concord Consortium
Center of Population
Let the resource take center stage in a lesson on population density. Scholars use provided historical data on the center of the US population to see how it shifted over time. They plot the data on a spreadsheet to look the speed of its...
American Statistical Association
Armspans
Young mathematicians collect data on the arm spans of classmates. Then they sort the data by measures of center, spread, and standard deviation. Finally, they compare groups, such as boys and girls, to interpret any differences.
Curated OER
Rebuilding The World Trade Center Site: A 9/11 Tribute
Students work together to build a memorial for the World Trade Center victims. In groups, they draw designs on what they believe the memorial should look like and write a proposal for the structure. To end the activity, they present...
Curated OER
Math and Architectural Design in Relation to Rebuilding The World Trade Center
Students discover building plans and practice reading measurements. In this architectural design lesson, students investigate the areas of the specific World Trade Center locations that need to be rebuilt and determine the cost....
Mathematics Assessment Project
Mean, Median, Mode, and Range
What a find! Here is a instructional activity, designed to meet sixth grade math Common Core standards, that focuses on the calculation of different measures of center for the scores from a penalty shoot-out competition. An independent...
Curated OER
Data Analysis
Young statisticians use and interpret measures of center and spread such as mean, median, and mode as well as range. They use box plots to represent their data and answer questions regarding the correspondence between data sets and the...
Mathematics Assessment Project
Statistics and Probability
Quickly assess basic understandings of statistics and probability. The resource contains five quick tasks from the probability and statistics domain. The questions range from finding simple conditional probabilities to measures of center...
CK-12 Foundation
Mode: Boxes of Oranges
See how your data stacks up. Pupils stack crates of oranges in increasing order, creating a simple bar graph. Using the graph, individuals determine measures of center and describe the shape of the distribution. Scholars determine what...
Curated OER
Rotations
In this rotations instructional activity, students draw and label a rotated image for each triangle and label its center. Students complete 6 problems.
Curated OER
Dilations
In this dilations worksheet, students draw and label dilated images for the triangles and label the centers. Students complete 6 problems total.
Curated OER
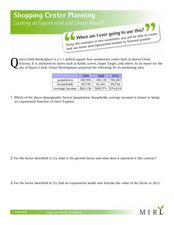
Looking at Exponential and Linear Models
In this shopping center worksheet, students use exponential and linear models to complete word problems about a shopping center. Students complete 6 problems.
Curated OER
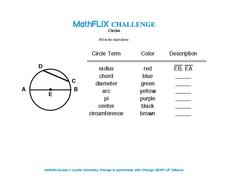
Circles
In this circles worksheet, 7th graders identify and complete 6 different problems that include determining various parts of a circle. First, they identify and define each circle term listed on the left. Then, students color each term...
Curated OER
Circles
Students graph circles. In this graphing instructional activity students write equations for circles. Students solve equations for circles and graph the results.
Illustrative Mathematics
Pennies to Heaven
Even though pennies seem to be relatively thin, stack enough of them into a single stack, and you could have quite a high stack. Enough so, that the final result can be a surprise to you as well as your class. This activity centers...
American Statistical Association
How Fast Are You?
Quick! Snap up the lesson. Scholars first use an online app to collect data on reaction times by clicking a button when the color of a box changes. They then plot and analyze the data by considering measures of center, measures of...
Illustrative Mathematics
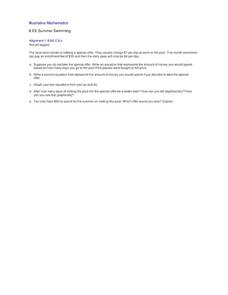
Summer Swimming
Here is a real-world application for systems of equations. When is it better to pay an enrollment fee and lower daily rate, and when is it better to pay the regular price? The local swim center is having a special offer, reductions in...
Curated OER
Math Learning Center: High Flyin' Math Facts
In this High Flyin' math facts activity, learners participate in an activity that combines various math problems that match up with each answer on the bows of the kites.
Curated OER
Making a Six-pointed Star
In this polygon worksheet, students identify and create a six-pointed star by completing 6 steps. First, they use a compass to trace a circle with a given radius. Then, students draw a point on circumference of the circle and place the...
Shodor Education Foundation
Plop It!
Build upon and stack up data to get the complete picture. Using the applet, pupils build bar graphs. As the bar graph builds, the interactive graphically displays the mean, median, and mode. Learners finish by exploring the changes in...
Curated OER
Reading and Interpreting Graphs
In this reading and interpreting graphs worksheet, students answer 8 word problems that involve reading information from a graph about pizzas. Students then review a second graph centered on music and answer 12 questions.
American Statistical Association
What is the Probability of “Pigging Out”
Learners apply their understanding of luck to a probability experiment. They play a game of Pass the Pigs to determine the probability of a specific outcome. Using analysis for their data, pupils declare the measures of center, dot...
Illustrative Mathematics
Rectangle Perimeter 2
While this activity is centered around expressions that represent the perimeter of a rectangle, it also hits at the fundamental concept of equivalent expressions, simplifing expressions, and like-terms. Classmates express their...
Blogger
Frayer Model
When learning new vocabulary, it is helpful for many learners to have a graphic organizer. With the Frayer model, the vocabulary word is placed in the center, then surrounded by a definition, facts or a description, examples, and...
Mathed Up!
Stem and Leaf Diagrams
Order the data within a stem-and-leaf display. Pupils take data and create and ordered stem-and-leaf diagrams, including the key. Participants take their data and determine answers about the information. Class members then find measures...
Other popular searches
- Center of Gravity
- World Trade Center
- Literacy Centers
- Media Center
- Kindergarten Math Center
- Math Centers
- Hands on Centers
- Money Math Centers
- Center for Disease Control
- Center of Circle
- Center of Gravity Activities
- Math Center Activities


