Curated OER
Data Analysis Using Technology
Analyze data using technology. Middle schoolers design data investigations, describe data, and draw their own conclusions. Then they select the best type of graph, graph and interpret the data, and look for patterns in trends. They also...
Curated OER
Introduction to Representing and Analyzing Data
Represent data graphically. Allow your class to explore different methods of representing data. They create foldables, sing songs, and play a dice game to reinforce the measures of central tendency.
Curated OER
Scatter-Brained
Seventh graders graph ordered pairs on a coordinate plane. They create a scatterplot. Additionally, they determine the line of best fit and investigate the slope of the line. Multiple resources are provided. An excellent resource!
Granite School District
7th Grade CCSS Math Vocabulary Word List
Address key vocabulary in the seventh grade Common Core Math Standards with this comprehensive list. A series of word cards is also provided that supports each term with images and examples, making this an excellent tool for teaching the...
West Contra Costa Unified School District
Comparing Data Displays
There is so much more to data than just numbers, and this resource has learners use three methods of comparing data in a multi-faceted lesson. The 21-page packet includes a warm-up, examples, an activity, and assessment for a complete...
Noyce Foundation
Ducklings
The class gets their mean and median all in a row with an assessment task that uses a population of ducklings to work with data displays and measures of central tendency. Pupils create a frequency chart and calculate the mean and median....
EngageNY
Using Sample Data to Compare the Means of Two or More Populations II
The 23rd segment in a series of 25 presents random samples from two populations to determine whether there is a difference. Groups determine whether they believe there is a difference between the two populations and later use an...
Shodor Education Foundation
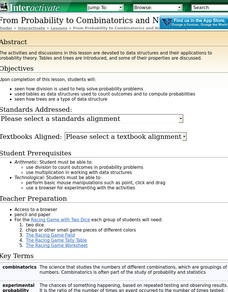
From Probability to Combinatorics and Number Theory
What middle schooler does not enjoy an occasional online game? In this lesson plan play, you will find embedded links to an online probability game, and informative pages about how division is used in probability, the concept of tree...
American Statistical Association
Exploring Geometric Probabilities with Buffon’s Coin Problem
Scholars create and perform experiments attempting to answer Buffon's Coin problem. They discover the relationships between geometry and probability, empirical and theoretical probabilities, and area of a circle and square.
EngageNY
Using Sample Data to Compare the Means of Two or More Populations
Determine whether there is a difference between two grades. Teams generate random samples of two grade levels of individuals. Groups use the mean absolute deviation to determine whether there is a meaningful difference between the...
Shodor Education Foundation
Playing with Probability
Review basic probability concepts with your class using different-colored marbles in a bag. Then pair up learners and have them play a cool online interactive game in which they race miniature cars using the roll of a die or two. The...
Curated OER
Data Analysis
Young statisticians use and interpret measures of center and spread such as mean, median, and mode as well as range. They use box plots to represent their data and answer questions regarding the correspondence between data sets and the...
Curated OER
Questioning NASA
Space science and math collide in this inquiry that investigates launching times for antacid-tablet rockets! Upper elementary or middle school learners collect data as they launch these mini rockets. They apply concepts of place value...
Curated OER
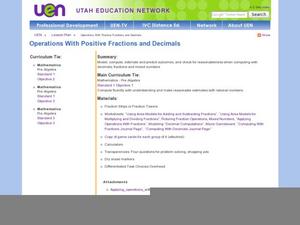
Operations with Positive Fractions and Decimals
Explore the concept of fractions and decimals! In this fractions and decimals lesson, pupils use fraction tiles to express fractions. They play a fraction review basketball game where when a team gets a question correct they get to shoot...
Google
Surveys and Estimating Large Quantities
Looking for an estimation activity a bit more involved than the typical "guess the number of jellybeans in the jar" game? Here, learners use a picture to estimate the number of people at a large event, look for potential problems with...
American Statistical Association
Don't Spill the Beans!
Become a bean counter. Pupils use a fun activity to design and execute an experiment to determine whether they can grab more beans with their dominant hand or non-dominant hand. They use the class data to create scatter plots and then...
American Statistical Association
How Long is 30 Seconds?
Is time on your side? Pupils come up with an experiment to test whether their classmates can guess how long it takes for 30 seconds to elapse. They divide the class data into two groups, create box-and-whisker plots, and analyze the...
American Statistical Association
Step into Statastics
Class members study the size of classmates' feet and perform a statistical analysis of their data. They solve for central tendencies, quartiles, and spread for the entire group as well as subgroups. They then write a conclusion based on...
National Security Agency
Are You Game? A Lesson Connecting Fractions and Probability
Exactly how fair are the board games children grow up playing? Young mathematicians investigate this questions as they work their way through this five-lesson series on basic probability.
Mathematics Assessment Project
Sampling and Estimating: Counting Trees
Your task today: count all the trees on a tree farm. To complete the assignment, learners first estimate the number of trees on a tree farm using random sampling. To improve their own response they then evaluate provided responses to the...
American Statistical Association
Happy Birthday to . . . Two?
How many people do you need in a room before two likely share the same birthday? Scholars consider this puzzle by analyzing a set of data. They ponder how to divide the data and determine the proper size of a group for this event to...
CCSS Math Activities
Smarter Balanced Sample Items: 7th Grade Math – Target H
Not one but two box plots. How will your pupils fare? Assess their understanding of box plots by having them compare two populations. The eighth of nine installments in the Gr. 7 Claim 1 Item Slide Shows series, the resource has them...
Shodor Education Foundation
Introduction to the Concept of Probability
Acquaint mathematicians to the concept of probability with a discussion about the results of a game. Then have them play a dice, card, spinner, or coin game and recording the number of wins vs. the number of tries on an interactive web...
Shodor Education Foundation
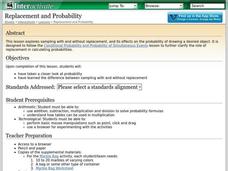
Replacement and Probability
Middle and high schoolers explore the concept of probability. In this probability lesson, learners conduct an experiment with a bag of marbles. Pupils draw marbles from a bag and determine the probability of drawing a particular color...
Other popular searches
- Making Inferences Worksheet
- Observation and Inferences
- Making Inferences in Reading
- Reading Making Inferences
- Making Inferences Grade 2
- Making Inferences Stories
- Lesson Making Inferences
- Inferences and Context Clues
- Generalizations / Inferences
- Inferences in Reading
- Reading Inferences
- Making Inferences 3rd Grade


