Charleston School District
Sketching a Piecewise Function
How do you combine linear and nonlinear functions? You piece them together! The lesson begins by analyzing given linear piecewise functions and then introduces nonlinear parts. Then the process is reversed to create graphs from given...
Virginia Department of Education
Nonlinear Systems of Equations
Explore nonlinear systems through graphs and algebra. High schoolers begin by examining the different types of quadratic functions and their possible intersections. They then use algebraic methods to solve systems containing various...
EngageNY
Exploring the Symmetry in Graphs of Quadratic Functions
Math is all about finding solutions and connections you didn't expect! Young mathematicians often first discover nonlinear patterns when graphing quadratic functions. The instructional activity begins with the vocabulary of a quadratic...
Illustrative Mathematics
Introduction to Linear Functions
Introduce your algebra learners to linear and quadratic functions. Learners compare the differences and relate them back to the equations and graphs. Lead your class to discussions on the properties of a function or a constant slope...
Willow Tree
Linear Relationships
There's just something special about lines in algebra. Introduce your classes to linear equations by analyzing the linear relationship. Young mathematicians use input/output pairs to determine the slope and the slope-intercept formula to...
Illustrative Mathematics
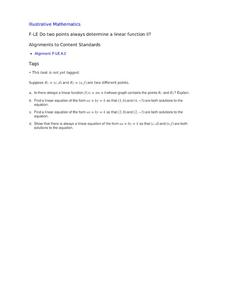
Do Two Points Always Determine a Linear Function?
Your learners can approach this task algebraically, geometrically, or both. They analyze the building of a linear function given two points and expand the concrete approach to the abstract when they are asked to find the general form of...
Curated OER
Linear Relations
In this linear relations worksheet, students complete a table for given functions. They classify graphs as linear or non-linear. Students graph given equations. They compare and contrast graphs. This nine page worksheet contains five...
Inside Mathematics
Functions
A function is like a machine that has an input and an output. Challenge scholars to look at the eight given points and determine the two functions that would fit four of the points each — one is linear and the other non-linear. The...
Curated OER
Graphing and Analyzing
In this graphing and analyzing worksheet, 9th graders first state if each graph represents a linear or nonlinear relationship. Second, they create a difference table for each set of data presented and determine whether it represents a...
EngageNY
Solution Sets to Inequalities with Two Variables
What better way to learn graphing inequalities than through discovering your own method! Class members use a discovery approach to finding solutions to inequalities by following steps that lead them through the process and even include...
Curated OER
Do Two Points Always Determine a Linear Function II?
Learners analyze the difference between the slope intercept and standard forms of a line in this task. Given two general points using letters they explore linear functions and linear equations.
EngageNY
Graphs of Quadratic Functions
How high is too high for a belly flop? Learners analyze data to model the world record belly flop using a quadratic equation. They create a graph and analyze the key features and apply them to the context of the video.
Curated OER
Graphs and Functions
Middle schoolers describe plotting functions on the Cartesian coordinate plane. They solve functions on paper and using an online tool to plot points on a Cartesian coordinate plane creating lines and parabolas.
Mathematics Assessment Project
Sorting Functions
There's no sorting hat here. A high school assessment task prompts learners to analyze different types of functions. They investigate graphs, equations, tables, and verbal rules for four different functions.
Mathematics Assessment Project
Representing Functions of Everyday Situations
Functions help make the world make more sense. Individuals model real-world situations with functions. They match a variety of contexts to different function types to finish a helpful resource.
Curated OER
Nonlinear Inequalities
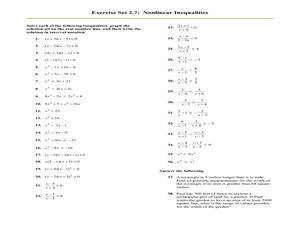
In this Algebra II worksheet, 11th graders solve nonlinear inequalities, graph the solution set on the number line, and write the solution in interval notation. The one page worksheet contains thirty-eight problems. Answers are provided.
Curated OER
Interactivate: Introduction to Functions
This interactive website provides a variety of lesson plans according to which standards you are applying and which textbook you use. Introduce functions to your class by having them construct single operation machines and create...
02 x 02 Worksheets
Inverse Variation
Discover an inverse variation pattern. A simple lesson plan design allows learners to explore a nonlinear pattern. Scholars analyze a distance, speed, and time relationship through tables and graphs. Eventually, they write an equation to...
Concord Consortium
The Line and the Ellipse
What do a line and an ellipse have in common? Maybe zero, one, or two points! Learners consider the equation of an ellipse and a line to determine if their graphs have any shared points. They then write a system of equations, including...
Curated OER
Linear and Nonlinear Functions
Students identify properties of a line. In this algebra lesson, students differentiate between functions and nonfunctions. They use the slope and y intercept to graph their lines.
Inside Mathematics
Graphs (2004)
Show your pupils that perimeter is linear and area is quadratic in nature with a short assessment task that requests learners to connect the graph and equation to a description about perimeter or area. Scholars then provide a...
EngageNY
The Height and Co-Height Functions of a Ferris Wheel
Show learners the power of mathematics as they model real-life designs. Pupils graph a periodic function by comparing the degree of rotation to the height of a ferris wheel.
EngageNY
Analyzing Residuals (Part 2)
Learn about patterns in residual plots with an informative math lesson. Two examples make connections between the appearance of a residual plot and whether a linear model is the best model apparent. The problem set and exit ticket...
Charleston School District
Analyzing Scatter Plots
Scatter plots tell a story about the data — you just need to be able to read it! Building from the previous lesson in the series where learners created scatter plots, they now learn how to find associations in those scatter plots. They...


