Curated OER
Technology Integration Project Weather Unit Plan
Students use a variety of technology-assisted weather observation tools to observe and record local weather. They identify, measure and record weather conditions, summarize types of clouds and make graphs of their observations. Students...
Curated OER
Egg Carton Binary Numbers
Learners take the abstract concept of binary representation and create a more tactile and concrete approach. Using egg cartons, they create a physical representation of binary numbers. The egg cartons become a tool to assist students in...
Kenan Fellows
Saving Those Who Save Us: Exploring the Use of Sensors with Data Visualization
Sensor technology is amazingly accurate and useful. Combining the sensor technology and mathematical knowledge, scholars design experiments to answer a question they have developed. Questions may focus on light sensing, temperature...
Illustrative Mathematics
How Thick Is a Soda Can II?
Science, technology, and math come together in this one combination exercise. Analyzing the common soda can from both a purely mathematical perspective and a scientific angle allows for a surprisingly sophisticated comparison of...
Curated OER
Podcasting Parabolas
Students explore parabolas. In this algebra and technology lesson, students construct the equation of a specific parabola, then take digital photos of real-life representations of these parabolas. Students create a podcast with a...
Curated OER
Math Lesson: What Do You Want to Know? - Country Statistics
Learners are able to identify the characteristics of a variety of graphs (i.e. bar graph, line graph, pie graph, scatter plot, population pyramids, etc.) They recognize how the type of data to be presented plays a role in choosing the...
Statistics Education Web
Saga of Survival (Using Data about Donner Party to Illustrate Descriptive Statistics)
What did gender have to do with the survival rates of the Donner Party? Using comparative box plots, classes compare the ages of the survivors and nonsurvivors. Using the same method, individuals make conclusions about the gender and...
Teach Engineering
It's Tiggerific!
Spring into elastic potential energy with a lesson that provides background information on determining the elastic potential energy of springs and other elastic materials. General energy equations emphasize the conservation of energy and...
Curated OER
Coming Clean About Showering Time
Learners measure objects using the Cabri Jr. application in this technology lesson. Your class will explore the TI-83 and 84 incorporated with Cabri Jr. to solve business related problems. This is a technology based lesson.
Curated OER
Geometric Relations
Students use computers to create a sketch of a geometrical shape that can be extruded to show the shape as a three-dimensional drawing. In this computer assisted drawing lesson plan, students follow explicit directions which include...
Curated OER
Properties of Parallelograms
Scholars explore parallelograms in this geometry lesson. They investigate the properties of a parallelogram. Assisted by technology, your learners will construct a parallelogram and examine the sides, angles, and diagonals to discover...
EngageNY
Ruling Out Chance (part 3)
Pupils analyze group data to identify significant differences. They use simulation to create their own random assignment data for comparison.
Curated OER
How Many Frogs?
Students explore the concept of linear regression. In this linear regression lesson, students find the line of best fit for a set of data pertaining to a frog population. Students use their line of best fit to predict the frog population...
California Mathematics Project
Reflections
Reflections are the geometric mirror. Pupils explore this concept as they discover the properties of reflections. They focus on the coordinates of the reflections and look for patterns. This is the third lesson in a seven-part series.
Teach Engineering
How Antibiotics Work
Take two pills and call me in the morning. The first lesson in a short unit of four introduces class members to delivery methods of medicines. The instruction introduces the question of which delivery method is best to get you feeling...
Teach Engineering
Microfluidic Devices and Flow Rate
When you have to flow, you have to flow. The lesson introduces class members to microfluidic devices and their uses in medicine. They watch a short video on how the diameter affects the rate of flow. The worksheet has individuals...
Curated OER
USING MICROSOFT, POWERPOINT, WORD, EXCEL AND THE INTERNET TO CREATE A PRESENTATION
Explore the basic PowerPoint commands and options. They research information (including the WWW) related to an approved topic for presentation development. They create a presentation defined by specific criteria. They document research...
Curated OER
Nutty for Nutrition
Students create a PowerPoint presentation detailing daily intake of nutrients. In this nutty for nutrition lesson, groups of students conduct Internet research to determine what type of nutrients should be consumed on a daily basis. ...
Curated OER
The Geometry of Circles
Students review the parts of a circle, calculate the circumference and area of a circle, and create student-made tests on the geometry of circles using educational software.
Curated OER
The Power of PV: Measuring the Power and Energy of Photovoltaic System
Students explore photovoltaic systems. In this alternative energy lesson, students calculate solar panel efficiency and convert devices to solar energy using photovoltaic cells.
Curated OER
Scientific Notation III: Linear vs Exponential
Young scholars after investigating examples of exponential growth students have an intuitive feel for the concept of exponential growth of a system.
Curated OER
The Solar Cycle
Learners research the solar cycle. In this Science lesson, students use the internet to investigate the solar cycle. Learners produce a spreadsheet and graph from the information collected.
Curated OER
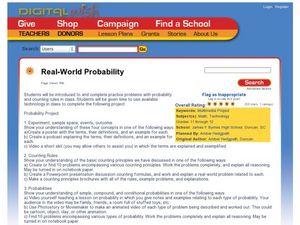
Real-World Probability
Students explore the concept of probability. In this probability lesson, students create a video, poster, or podcast explaining what experiments, sample space, events, and outcomes are in relation to probability. Students create a...
Curated OER
When A Car Coughs. . .
Budding scientists collect and compare particulate exhaust from four different vehicles. They discuss how cars contribute to air quality. To get the most mileage out of this resource, have learners complete the optional step 5, in which...


