EngageNY
Summarizing Bivariate Categorical Data
How do you summarize data that cannot be averaged? Using an exploratory method, learners complete a two-way frequency table on super powers. The subject matter builds upon 8th grade knowledge of two-way tables.
Statistics Education Web
Saga of Survival (Using Data about Donner Party to Illustrate Descriptive Statistics)
What did gender have to do with the survival rates of the Donner Party? Using comparative box plots, classes compare the ages of the survivors and nonsurvivors. Using the same method, individuals make conclusions about the...
American Statistical Association
Don't Spill the Beans!
Become a bean counter. Pupils use a fun activity to design and execute an experiment to determine whether they can grab more beans with their dominant hand or non-dominant hand. They use the class data to create scatter plots and then...
American Statistical Association
Candy Judging
Determine the class favorite. The statistics lesson plan has pupils collect, display, and analyze data. Pairs rank four kinds of candy based on their individual preferences. Working as an entire class, learners determine a way to display...
Curated OER
Accidents Happen: Seat Belt Laws, Enforcement, and Usage
Start with a NOVA video about car crashes, crash test dummy footage, or other video about seat belt use. Or have groups review attached data about seat belt usage (by state) and share their conclusions. Learners then devise a method to...
Curated OER
Button Bonanza
Collections of data represented in stem and leaf plots are organized by young statisticians as they embark some math engaging activities.
Beyond Benign
Can You Hear Me Now? Cell Phone Accounts
How sustainable are cell phones? Throughout the unit, learners explore the issues around cell phones concerning sustainability. Class members take a graphical look at the number of cell phones across the world using a box-and-whisker...
Radford University
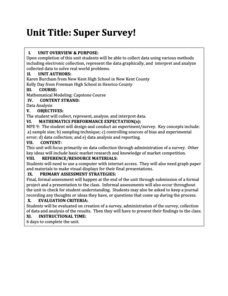
Super Survey!
Here's a super survey on supermarket products. An interactive lesson has classmates design and conduct surveys on a product of interest. They analyze the data, choose a data display method, and present their findings to the class.
Curated OER
Ornithology and Real World Science
Double click that mouse because you just found an amazing lesson! This cross-curricular Ornithology lesson incorporates literature, writing, reading informational text, data collection, scientific inquiry, Internet research, art, and...
EngageNY
Estimating Probabilities by Collecting Data
Take a spin to determine experimental probability. Small groups spin a spinner and keep track of the sums of the spins and calculate the resulting probabilities. Pupils use simulated frequencies to practice finding other probabilities to...
Statistics Education Web
10,000 Steps?
Conduct an experiment to determine the accuracy of pedometers versus pedometer apps. Class members collect data from each device, analyze the data using a hypothesis test, and determine if there is a significant difference...
Intel
Forensics: Get a Clue
Although the methods are all scientific, forensic science was started by police officers rather than scientists, who relied on observation and common sense. Young detectives use many tools to solve crimes around the school in a...
Radford University
Tuition Cost Activity
Can I afford to go to college? Small groups design a method to research college tuition for several years and make a prediction of costs in 2025. Classmates plot the the data on a scatter plot and graph the line of best fit to make their...
Radford University
Can I Create a Line/Curve of Best Fit to Model Water Drainage?
Learners collect data on the amount of water left in a bottle over time. They graph the data to determine whether the scatter plot shows a curved or straight relationship. Group members then determine an equation for the curve of best...
Worksheet Place
How I Get to School
Find out how many of your learners take the bus, how many walk, and how many bike with a quick survey. Class members gather data about how each individual gets to school and mark the results on this page in order to create a bar graph.
EngageNY
From Ratio Tables, Equations and Double Number Line Diagrams to Plots on the Coordinate Plane
Represent ratios using a variety of methods. Classmates combine the representations of ratios previously learned with the coordinate plane. Using ratio tables, equations, double number lines, and ordered pairs to represent...
Radford University
Survey Activity
It's time to take a survey. After looking at an example of a survey on lunch preferences, groups design their own surveys. They consider the sample size and sampling technique, then conduct the surveys. As a final activity, they create...
EngageNY
Selecting a Sample
So what exactly is a random sample? The 15th part in a series of 25 introduces the class to the idea of selecting samples. The teacher leads a discussion about the idea of convenient samples and random samples. Pupils use a random...
Radford University
Projectile Motion and Quadratic Functions
Model the flight of a ball. Small groups collect time data for how long it takes to toss a ball between two people. The teacher leads a discussion about projectile motion to get the class thinking about how to calculate the equation of...
American Statistical Association
How Tall and How Many?
Is there a relationship between height and the number of siblings? Classmates collect data on their heights and numbers of brothers and sisters. They apply statistical methods to determine if such a relationship exists.
Science 4 Inquiry
The Ups and Downs of Populations
As the reality of population decline across many species becomes real, pupils learn about the variables related to changes in populations. They complete a simulation of population changes and graph the results, then discuss limiting...
Virginia Department of Education
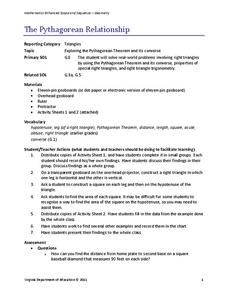
The Pythagorean Relationship
Add up areas of squares to discover the pythagorean relationship. Small groups create right triangles with squares along each side. They calculate the areas of each square and notice the relationship. Groups construct other types of...
Teach Engineering
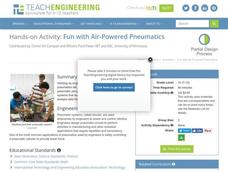
Fun with Air-Powered Pneumatics
How high did the ball go? Engineering teams build a working pneumatic system that launches a ball into the air. The teams vary the amount of pressure and determine the accompanying height of the ball. An extension of building a device to...
Visa
Money Responsibility
Introduce young learners to the important life skill of responsibly managing money and recording how much they spend and save.


