EngageNY
Percent Error Problems
Individuals measure a computer monitor and determine how accurate their measures are. The eighth segment in a series of 20 introduces the concept of percent error. Pupils find the percent error of their measurements and discuss the...
EngageNY
Understanding Variability When Estimating a Population Proportion
Estimate the proportion in a population using sampling. The 20th installment in a series of 25 introduces how to determine proportions of categorical data within a population. Groups take random samples from a bag of cubes to determine...
Illustrative Mathematics
Making a Clock
Have a fun time teaching children to read analog clocks with this whole-group math activity. Using large sets of the numerals 1-12 and 0, 5, 10...55, the teacher creates a large clock on either the carpet or the white board, explaining...
West Contra Costa Unified School District
Introduction to Inverse Functions
Ready to share the beauty of the inverse function with your classes? This algebra II lesson guides the discovery of an inverse function through a numerical, graphical, and an algebraic approach. Connections are made between the three,...
Pace University
Grades 7-8 Mean, Median, and Mode
Take a central look at data. The differentiated lesson provides activities for pupils to calculate central tendencies. Scholars begin choosing three central tendency activities from a Tic-Tac-Toe board. Learners then choose from sports,...
EngageNY
Solving Problems in Two Ways—Rates and Algebra
Build confidence by using multiple approaches to problem solving! This resource uses a visual and algebraic approach to solving application problems. A discussion is included about efficient approaches to different problems.
National Gallery of Canada
Counting Circles
Learners look at bands of colors and estimate how many rings of color there are. While working in groups, they come up with a plan of how to accurately count the rings. They attempt to find a pattern in the colors, and decide whether...
Scholastic
Adding and Subtracting Ten
Developing fluency with basic addition and subtraction is fundamental to the success of all young mathematicians. This four-day lesson series begins with learners using ten-frames and hundreds charts to recognize patterns when adding and...
Illustrative Mathematics
Battery Charging
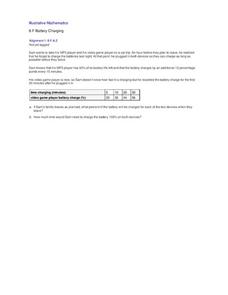
Your class will be very interested in the results of this activity. How long does it take a MP3 and video game player to charge? Sam only has an hour and the MP3 player only has 40% of its battery life left. Plus, his video player is...
EngageNY
Summarizing Bivariate Categorical Data
How do you summarize data that cannot be averaged? Using an exploratory method, learners complete a two-way frequency table on super powers. The subject matter builds upon 8th grade knowledge of two-way tables.
EngageNY
The Scaling Principle for Area
As they investigate scaling figures and calculate the resulting areas, groups determine the area of similar figures. They continue to investigate the results when the vertical and horizontal scales are not equal.
Buffalo State
Adding and Subtracting Integers Unit
Just because one integer is larger than another doesn't mean it will make sense right away. Go beyond note taking and show learners, through the use of algebra tiles and a Four-Pan Algebra Balance, how the numbers relate to one another...
EngageNY
Function Composition
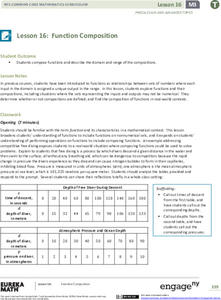
Combine functions for the first time. Pupils investigate composition of functions using a function table and then function machines in the 17th installment in a 23-part Precalculus series. Scholars learn the two notations for composition...
EngageNY
The Structure of Rational Expressions
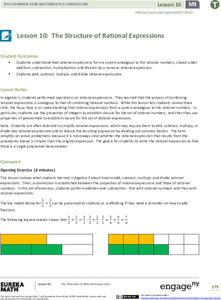
Find out when rational expressions are closed. Pupils review adding, subtracting, multiplying, and dividing with rational numbers to make the connections to operations with rational expressions. Using specific examples, learners notice...
EngageNY
Problem Solving Using Rates, Unit Rates, and Conversions
Find a way to work with rates. The 23rd part in a 29-part series presents work problems for the class to solve given work rates. Pupils compare rates to determine which is faster. Some problems require learners to convert the rates to...
EngageNY
Solving Percent Problems
Don't discount how much your pupils understand percents! The 27th lesson in a series of 29 presents a problem to find the cost of a discounted outfit. Small groups determine either the original price or the discount received given the...
EngageNY
Comparing Data Distributions
Box in the similarities and differences. The 19th lesson in a unit of 22 presents class members with multiple box plots to compare. Learners use their understanding of five-number summaries and box plots to find similarities and...
EngageNY
Comparing Quantities with Percent
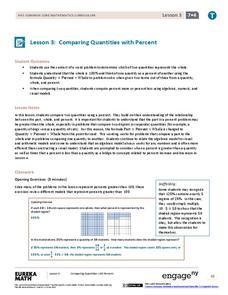
Be 100 percent confident who has the most and by how much. Pupils use percentages to help make the comparisons by finding what percent one quantity is of the other. They also determine the percent differences between the two quantities.
EngageNY
Describing the Center of a Distribution Using the Median
Find the point that splits the data. The lesson presents to scholars the definition of the median through a teacher-led discussion. The pupils use data lists and dot plots to determine the median in sets with even and odd number of data...
EngageNY
Describing Center, Variability, and Shape of a Data Distribution from a Graphical Representation
What is the typical length of a yellow perch? Pupils analyze a histogram of lengths for a sample of yellow perch from the Great Lakes. They determine which measures of center and variability are best to use based upon the shape of the...
Virginia Department of Education
Exploring Statistics
Collect and analyze data to find out something interesting about classmates. Groups devise a statistical question and collect data from their group members. Individuals then create a display of their data and calculate descriptive...
Virginia Department of Education
Special Right Triangles and Right Triangle Trigonometry
Right triangles are so special! Use special right triangles to discover the trigonometric ratios. Pairs construct special right triangles and find the values of the ratios of the sides. In the process, they discover the ratios stay the...
MARS - Mathematics Assessment Resource Service
Applying Properties of Exponents
The properties of exponents are all linked together and it is your mathematicians' job to discover and apply those rules. The comprehensive activity begins with a pre-assessment task to check for prior knowledge and then goes into a...
Curated OER
A Sum of Functions
Collaborative learners will see the geometric addition of functions by graphing the sum of two graphed curves on the same coordinate plane. This task then naturally flows into giving learners the algebraic representation of the curves...


