EngageNY
Four Interesting Transformations of Functions (Part 1)
Understanding how functions transform is a key concept in mathematics. This introductory lesson makes a strong connection between the function, table, and graph when exploring transformations. While the resource uses absolute value...
Curated OER
Dragonfly
The speed of a dragonfly brings math into the real world as your learners collaboratively see the value in calculating unit rates in direct proportion problems. This six-phase lesson plan encourages you, as the teacher, to only ask...
Illustrative Mathematics
Which Weighs More? Which Weighs Less?
Expand the the comparative language of young mathematicians with a hand-on weight measurement activity. Working independently or in pairs, children compare the weight of large wooden blocks to various other classroom objects, recording...
EngageNY
Summarizing a Data Distribution by Describing Center, Variability, and Shape
Put those numbers to work by completing a statistical study! Pupils finish the last two steps in a statistical study by summarizing data with displays and numerical summaries. Individuals use the summaries to answer the statistical...
EngageNY
Connecting Graphical Representations and Numerical Summaries
Which graph belongs to which summary statistics? Class members build upon their knowledge of data displays and numerical summaries to connect the two. Pupils make connections between different graphical displays of the same data in the...
EngageNY
Understanding Box Plots
Scholars apply the concepts of box plots and dot plots to summarize and describe data distributions. They use the data displays to compare sets of data and determine numerical summaries.
Mathematics Assessment Project
Interpreting Distance–Time Graphs
Pre-algebra protégés critique a graph depicting Tom's trip to the bus stop. They work together to match descriptive cards to distance-time graph cards and data table cards, all of which are provided for you so you can make copies for...
Curated OER
Exponential Growth versus Linear Growth II
Your algebra learners discover that exponential functions, with a base larger than one, outgrow linear functions when the inputs increase sufficiently. Their analysis includes using a graphing calculator to produce tables.
Illustrative Mathematics
Fixing the Furnace
This comprehensive resource applies simultaneous equations to a real-life problem. Though the commentary starts with a graph, some home consumers may choose to begin with a table. A graph does aid learners to visualize the shift of one...
EngageNY
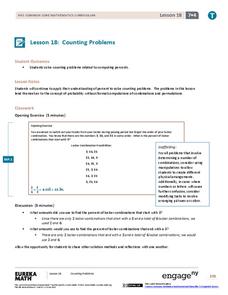
Counting Problems
Solving these percent problems is a matter of counting. Pupils find percents by counting the number of events that meet the criteria and the total number of possibilities. Participants create the ratio and convert it to a percent to...
EngageNY
Addition and Subtraction Formulas 2
Knowing the addition formulas allows for the calculations of double and half formulas. The fourth installment of 16 has the class use the addition formula to develop the double angle trigonometric formulas. Using the double formula,...
EngageNY
An Exercise in Creating a Scale Drawing
Design your dream classroom. The lesson plan contains an exercise to have teams create a scale drawing of their dream classroom. Pairs take the measurements of their classroom and furniture and create a scale factor for them. To finish...
EngageNY
Putting the Law of Cosines and the Law of Sines to Use
Use the Law of Cosines and the Law of Sines to solve problems using the sums of vectors. Pupils work on several different types of real-world problems that can be modeled using triangles with three known measurements. In the process,...
EngageNY
Describing Distributions Using the Mean and MAD
What city has the most consistent temperatures? Pupils use the mean and mean absolute deviation to describe various data sets including the average temperature in several cities. The 10th lesson in the 22-part series asks learners to...
NASA
Earth, Can You Hear Me Now?
How long did you say? Class groups plot the distances between Earth and Mars and determine the trigonometric function that models the data. Using a calculator, they graph the function to determine when the distance and communication...
EngageNY
Population Problems
Find the percent of the population that meets the criteria. The 17th segment of a 20-part unit presents problems that involve percents of a population. Pupils use tape diagrams to create equations to find the percents of subgroups of the...
EngageNY
Modeling a Context from Data (part 2)
Forgive me, I regress. Building upon previous modeling activities, the class examines models using the regression function on a graphing calculator. They use the modeling process to interpret the context and to make predictions based...
NASA
Lunar Rover
What is the shortest distance/time needed to complete a mission? Groups devise a strategy in order to determine the shortest distance and time connecting two points and a segment. They then use graphing, the distance formula, and a...
Curated OER
Tiles, Blocks, Sapphires & Gold: Designing a Treasure Map
Young cartographers in groups hide treasure at school and then create a map to find it using pattern blocks and tiles. They make paintings with clues to create a visual representation of the location of their treasure. Groups present...
Natinal Math + Science Initative
Slope Investigation
Context is the key to understanding slope. A real-world application of slope uses a weight loss scenario with a constant rate of change to introduce the concept of slope of a line, before it makes a connection to the ordered pairs and...
Alabama Learning Exchange
Ice Fishing is for the Birds
Approach addition with young mathematicians in an engaging way through this penguin-inspired activity. In small groups, scholars think about times they have used addition in their real lives (there are some suggestions given), then watch...
Alabama Learning Exchange
Pennies, Pennies and More Pennies
Learners determine the number of pennies needed to fill a room. In this pennies lesson plan, students work in groups to determine the number of pennies needed to fill a room. They compute the probability of the head of a pin landing on...


