Curated OER
US Population 1982-1988
Your algebra learners make predictions using the concepts of a linear model from real-life data given in table form. Learners analyze and discuss solutions without having to write a linear equation.
Museum of Tolerance
Where Do Our Families Come From?
After a grand conversation about immigration to the United States, scholars interview a family member to learn about their journey to America. They then take their new-found knowledge and apply their findings to tracking their family...
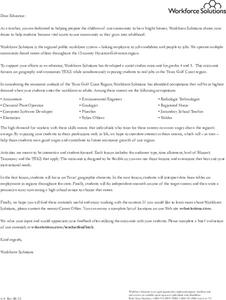
Workforce Solutions
Workforce Solutions 4-5 Lessons
Four lessons focus on job opportunities in Texas. In the first lesson, scholars examine the geography of Texas in preparation for analyzing data that showcases the economy of different regions. Lesson three challenges pupils to research...
NASA
Christa's Lost Lesson: Effervescence
How are chemical reactions affected by gravity? Learners explore the phenomenon of effervescence as part of the Christa's Lost Lessons series. They compare findings in an experiment on effervescence to a video of a similar experiment in...
Curated OER
Is Your Water Clean?
Learners compare water quality of different sources. They test water samples for odor, phosphates, pH, bacteria, and dissolved solids. they fill out a data table and answer questions about their findings.
Illinois State Board of Education
Common Core Teaching and Learning Strategies
Here's a resource that deserves a place in your curriculum library, whether or not your school has adopted the Common Core. Designed for middle and high school language arts classes, the packet is packed with teaching tips, materials,...
Towson University
Mystery of the Crooked Cell
Can your class solve the Mystery of the Crooked Cell? Junior geneticists collaborate to learn about sickle cell anemia in a fascinating lesson plan. The included materials help them to examine the genetic factors behind the disease...
Curated OER
Introduction to Graphical Representation of Data Sets in Connection with Nuclear Decay
Students record data, make observations, and share in experimentation and discussion of numerical experiments.
EngageNY
Sampling Variability and the Effect of Sample Size
The 19th installment in a 25-part series builds upon the sampling from the previous unit and takes a larger sample. Pupils compare the dot plots of sample means using two different sample sizes to find which one has the better variability.
Serendip
Understanding and Predicting Changes in Population Size – Exponential and Logistic Population Growth Models vs. Complex Reality
Salmonella poisoning impacts over 200,000 people in the United States each year. Scholars learn about the growth of these bacteria using multiple approaches. Then they apply the same growth calculations to endangered species and think...
NOAA
What Killed the Seeds?
Can a coral cure cancer? Take seventh and eighth grade science sleuths to the underwater drugstore for an investigation into emerging pharmaceutical research. The fifth installment in a series of six has classmates research the wealth of...
Bonneville
Creating the Most Effective Solar Heater
If changing one variable can improve a design, why not try changing more? Using the results from the previous activity, scholars decide on the variables that caused the most improvement in the effectiveness of the solar heater. They take...
Curated OER
Diurnal Cycling Experiments
Learners carry out an experiment to monitor diurnal fluctuations in dissolved oxygen, carbon dioxide, pH, and water temperature. They determine the CO2 and pH of the samples (and optionally, dissolved oxygen). Students complete their...
University of Georgia
Energy Content of Foods
Why do athletes load up on carbohydrates the evening before a competition? The lesson helps answer this question as it relates the type of food to the amount of energy it contains. After a discussion, scholars perform an experiment to...
Agriculture in the Classroom
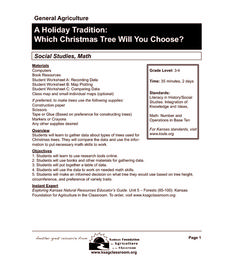
A Holiday Tradition: Which Christmas Tree Will You Choose?
Different varieties of Christmas trees provide an interesting way to combine social studies, science, math, and technology. Class members not only research the history of the Christmas tree holiday tradition, they compare and contrast...
ARKive
Biodiversity and Evolution – Darwin’s Finches
Teens experience natural selection firsthand (or first beak) in an activity that has them act as finches foraging for food. Using different household items to act as different beak styles, your little finches will collect as much food...
Curated OER
Exploring Linear Equations And Scatter Plots - Chapter 5 Review
Students complete rolling stocks experiment, and collect and enter data on the computer. They enter data on graphing calculators, complete scatter plot by hand with line of best fit, and discuss different graphing methods.
Curated OER
Genetic Drift
Students use a mathematical simulation of genetic drift to answer questions about the factors that influence this evolutionary process. They run a series of simulations varying allele frequency and population size and then analyze their...
Mathematics TEKS Toolkit
Grade 6: Exploring c/d = pi
Introduce your math class to the perimeter of a circle. Teach them that pi describes the relationship between the circumference and the diameter. As a hands-on investigation, pairs or small groups use string to compare these two values...
Curated OER
What Do We Learn From the Repartiation of Alaska Native Artifacts?
Students observe and evaluate evidence of Alaska Native cultural symbols and artifacts. They research historical data from a variety of primary resources, including the Harriman expedition journals, related web sites, oral accounts,...
Curated OER
How Has Transportation Changed Since the 1899 Harriman Alaska Expedition?
Students recognize modes of transportation. They research historical data from a variety of primary and secondary sources including the Harriman expedition journals, related web sites, and photographs from the expedition. Students...
Kid Zone
Groundhog's Day Graphing
This Groundhog's Day, challenge scholars to predict, estimate, tally, and graph in a weather-themed lesson in which class members play the role of the groundhog to forecast the weather come February second.
Curated OER
Periodic Table Lesson Plan
Learners describe how elements are arranged on the periodic table. They compare metals, nonmetals, and metalloids based on their properties and on their locations in the periodic table. Students describe the differences between a...
Curated OER
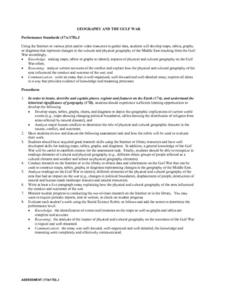
Geography And The Gulf War
Students develop maps, tables, graphs, charts, and diagrams to depict the geographic implications of current world events, and analyze major human conflicts to determine the role of physical and cultural geographic features in the...
Other popular searches
- Data Tables
- Data Displays
- Displaying Data
- Create Data Table
- Data Table and Graph
- Creating Data Tables
- Science Data Tables
- Creating a Data Table
- Making Data Tables
- Organizing Data in Tables
- Solar System Data Table
- Data Tables and Graphing


