Willow Tree
Line Plots
You can't see patterns in a jumble of numbers ... so organize them! Learners take a set of data and use a line plot to organize the numbers. From the line plot, they find minimum, maximum, mean, and make other conclusions about the...
EngageNY
Patterns in Scatter Plots
Class members investigate relationships between two variables in the seventh installment of a 16-part module that teaches scholars how to find and describe patterns in scatter plots. Young mathematicians consider linear/nonlinear...
EngageNY
Scatter Plots
Scholars learn to create scatter plots and investigate any relationships that exists between the variables with a lesson that also show them that statistical relationships do not necessarily indicate a cause-and-effect...
Willow Tree
Scatterplots and Stem-and-Leaf Plots
Is there a correlation between the number of cats you own and your age? Use a scatter plot to analyze these correlation questions. Learners plot data and look for positive, negative, or no correlation, then create stem-and-leaf plots to...
Curated OER
Birds' Eggs
More than just data, scatter plots are full of information that can be used to answer a variety of questions. This lesson uses a plot with information about bird egg sizes to answer questions about the relationship between length and...
National Security Agency
Line Plots: Frogs in Flight
Have a hopping good time teaching your class how to collect and graph data with this fun activity-based lesson series. Using the provided data taken from a frog jumping contest, children first work together...
EngageNY
Analyzing Plot Development across Flush
The end. Scholars discuss how the end of the text in Flush contributes to the plot development of the story. They then write book reviews to share their thoughts about the story. After finishing their book reviews, learners share them...
Mathed Up!
Cumulative Frequency and Box Plots
Learn how to display data. Young data analysts watch a video to review how to create cumulative frequency histograms and box plots. They work on a set of questions to practice producing these data displays.
Texas Education Agency (TEA)
Archetypes, Motifs, and Plot in Drama (English II Reading)
The second interactive in a series of 10 introduces young scholars to character archetypes, archetypal plot patterns, and archetypal motifs, including the use of color. Learners read passages explaining the term and study examples from...
Flipped Math
Create and Analyze Graphs
Model the world with graphs. Pupils watch and participate in creating graphs to model real-world situations. The presenters stress the importance of a consistent scale and proper labels for the graphs along with identification of the...
Willow Tree
Box-and-Whisker Plots
Whiskers are not just for cats! Pupils create box-and-whisker plots from given data sets. They analyze the data using the graphs as their guide.
Read Write Think
Book Report Alternative: Rewind the Plot!
Have you ever looked for a new way to teach an old concept? Scholars thinking about the rising action of a story in a whole new perspective. However, Book Report Alternative: Rewind the Plot! challenges readers and allows for much...
CK-12 Foundation
Plots of Polar Coordinates: Submarine Sonar
Find the location of enemy submarines with a sonar display that doubles as a polar coordinate system. Pupils find polar coordinates that would be the same location of plotted submarines. They then determine multiple polar...
EngageNY
Analyzing Residuals (Part 1)
Just how far off is the least squares line? Using a graphing calculator, individuals or pairs create residual plots in order to determine how well a best fit line models data. Three examples walk through the calculator procedure of...
Project Maths
Correlation Coefficient
Of course, there might be a correlation! Young mathematicians investigate several different data sets, create scatter plots, and determine any correlation. They consider whether a causation exists between any of the variables in question.
National Endowment for the Humanities
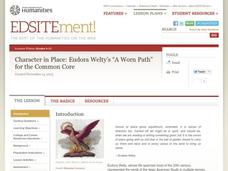
Character in Place: Eudora Welty’s “A Worn Path” for the Common Core
How do writers use the interaction between elements like characterization and setting to create meaning? Readers of "A Worn Path" create a series of comic book-style graphics of Eudora Welty's short story and reflect on how Welty...
Scholastic
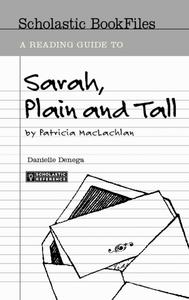
A Reading Guide to Sarah, Plain and Tall
Eliminate the hard work of creating an entire literature unit with this reading guide for the novel Sarah, Plain and Tall. From background information about the author and her motivation for writing the story to...
Annenberg Foundation
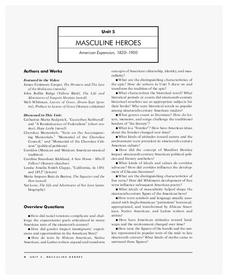
Masculine Heroes
What were the driving forces behind American expansion in the nineteenth century, and what were its effects? Scholars watch a video, read biographies, engage in discussion, write journals and poetry, draw, and create a multimedia...
Core Knowledge Foundation
Fables and Stories Tell It Again!™ Read-Aloud Anthology
A read-aloud anthology focuses on fables. Over three weeks, first graders listen to various stories and then participate in lessons that cover story elements, including plot, characters, setting, and personification and explore...
ReadWriteThink
Literature Circles: Getting Started
Make reading more enjoyable and interactive with literature circles! Here you'll find detailed lessons to begin the literature circle process. Ten lessons introduce each role learners take on. Literature circle roles include...
CK-12 Foundation
Graphs of Functions Based on Rules: Plotting Profits
Profit from this interactive on graphing and interpreting functions. An interactive allows learners to plot a square root function representing a company's profits. They answer some challenge questions that require interpreting this...
Curated OER
Flicking Football Fun
Young mathematicians fold and flick their way to a deeper understanding of statistics with a fun, hands-on math unit. Over the course of four lessons, students use paper footballs to generate data as they learn how to create line...
Curated OER
Button Bonanza
Collections of data represented in stem and leaf plots are organized by young statisticians as they embark some math engaging activities.
Teach Engineering
Coordinates and the Cartesian Plane
The plot thickens to get a functional understanding. After a short review of plotting points on the coordinate plane, class members learn the difference between functions and relations in the second lesson in a series of nine. They...


