EngageNY
Interpreting Correlation
Is 0.56 stronger than -0.78? Interpret the correlation coefficient as the strength and direction of a linear relationship between two variables. An algebra lesson introduces the correlation coefficient by estimating and then calculating it.
EngageNY
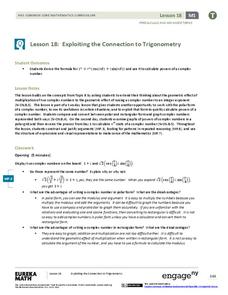
Exploiting the Connection to Trigonometry 1
Class members use the powers of multiplication in the 19th installment of the 32-part unit has individuals to utilize what they know about the multiplication of complex numbers to calculate the integral powers of a complex number. Groups...
Willow Tree
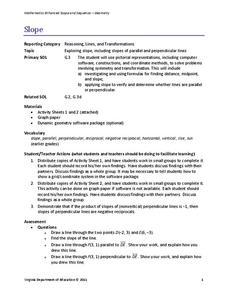
Slope
Investigate the different types of slope using graphs and ordered pairs. Scholars use the slope formula to determine the slope of a line between two points. Includes examples with a slope of zero and with no slope. The lesson follows a...
EngageNY
Multi-Step Problems in the Real World
Connect graphs, equations, and tables for real-world problems. Young mathematicians analyze relationships to identify independent and dependent variables. These identifications help create tables and graphs for each situation.
UAF Geophysical Institute
Carbon Footprint
Your young environmentalists can calculate their carbon footprint and discuss ways to reduce it with a worksheet about climate change. After reading a handout about what impact one's carbon footprint can have on the environment, kids...
Flipped Math
Modeling with Quadratics
Do some interpretive modeling. Class members watch three examples of interpreting key features of a graph of a quadratic to find solutions to a real-world problem. Learners review how to find the key features on a graph using technology...
Flipped Math
Sketching Polynomial Functions
Provide a sketch of the suspect. Scholars see how to use the key aspects they know about polynomials to create a sketch of the graph. Learners factor to calculate the zeros by factoring, find the end behavior, and determine the...
Utah Education Network (UEN)
Ratio Relations
At this rate, the class will be experts on ratios and rates in no time. A class workbook teaches individuals about ratio language, using tables and tape diagrams to find equivalent ratios, and solving ratio problems. They then discover...
Virginia Department of Education
Factoring for Zeros
Relate factors to zeros and x-intercepts. Scholars first graph quadratics in both standard and factored forms to see that they are the same. They go on to use the graphs to see the relationship between factors and x-intercepts.
Mathed Up!
Scatter Graphs
Make an estimate by getting in line. The class works with scatter plots and lines of best fit to make an estimate for given values. Pupils determine whether there is a positive or negative correlation and draw a best-fit line. Using the...
National Research Center for Career and Technical Education
Architecture and Construction: Stair Construction
Within the context of the construction industry, algebra pros begin to calculate slope from the sizes of stair steps. This is a terrific lesson, especially for aspiring engineers. Just be aware that it might be a stretch to meet all of...
Flipped Math
Correlation
Determine how close the line is to the scatter plot. Clear video instruction shows how to plot a scatter plot and find the best fit line using the linear regression function on a calculator. Pupils use the information from the calculator...
Federal Reserve Bank
Making Sense of the Ups and Downs of Prices
What are the consequences and costs of inflation? What is CPI, and how do we calculate it? This resource answers these questions in an organized and in-depth manner, and also includes a worksheet of follow-up questions designed for an...
Corbett Maths
Average Rate of Change
Simply find the slope to find the average rate of change. A short video provides the definition of the average rate of change. Using the definition, pupils calculate the average rate of change to solve problems that cover finding average...
EngageNY
The Slope of a Non-Vertical Line
This lesson introduces the idea of slope and defines it as a numerical measurement of the steepness of a line. Pupils then use the definition to compare lines, find positive and negative slopes, and notice their definition holds for...
Virginia Department of Education
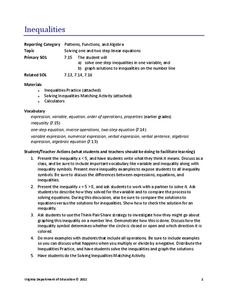
Inequalities
Compare graphing an inequality in one variable on a number line to graphing an inequality in two variables on a coordinate plane. Young mathematicians work on a puzzle matching inequalities and their solutions. They then complete a...
EngageNY
Exploiting the Connection to Trigonometry 2
The class checks to see if the formula for finding powers of a complex number works to find the roots too. Pupils review the previous day's work and graph on the polar grid. The discussion leads the class to think about how to reverse...
West Contra Costa Unified School District
Derivative – Standard Definition
Making a clear connection to algebra concepts helps learners understand the definition of a derivative. The lesson begins with looking at limits of simple linear and rational functions, and leads to the definition of the derivative....
Virginia Department of Education
Surface Area of a Rectangular Prism
Wrap up a lesson on surface area with a resource that asks scholars to use the idea of wrapping paper to investigate surface area. They draw representations of rectangular prisms on graph paper to find the areas of the respective...
Corbett Maths
Inverse Proportion
Take an indirect view of proportionality. Using a similar approach of direct variation, the resource shows how to solve inverse proportions. The video steps through finding the constant of proportionality to write the formula for the...
EngageNY
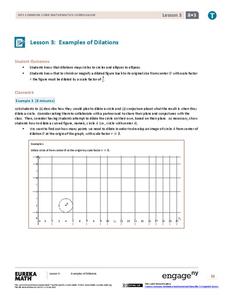
Examples of Dilations
Does it matter how many points to dilate? The resource presents problems of dilating curved figures. Class members find out that not only do they need to dilate several points but the points need to be distributed about the entire curve...
02 x 02 Worksheets
Slope
What does slope have to do with lines? Pupils work with lines and determine the slope of the lines informally and with the slope formula. Groups use their knowledge to calculate the slopes of parallel and perpendicular lines. They also...
Teach Engineering
Applications of Linear Functions
It's not so straightforward — lines can model a variety of applications. Pupils experience linear relationships within the context of science, including Hooke's and Ohm's Laws. Class members got a taste of motion and speed from the...
Virginia Department of Education
Inequalities
Not all resources are created equal — and your class benefits! Scholars learn how to solve one-step inequalities using inverse operations. They complete an activity matching inequalities to their solutions.
Other popular searches
- Graphing Calculator and Math
- Algebra Graphing Calculators
- Graphing Calculator Math
- Graphing Calculator Skills
- Graphing Calculator Squares
- Graphing Calculator Lessons
- Graphing Calculator Parabola
- Graphing Calculators Ti 83
- Graphing Calculator Activities
- Graphing Calculator Worksheet
- Ti 84 Graphing Calculator


