EngageNY
Nonlinear Models in a Data Context
How well does your garden grow? Model the growth of dahlias with nonlinear functions. In the lesson, scholars build on their understanding of mathematical models with nonlinear models. They look at dahlias growing in compost and...
EngageNY
Graphs of Linear Functions and Rate of Change
Discover an important property of linear functions. Learners use the slope formula to calculate the rates of change of linear functions. They find that linear functions have constant rates of change and use this property to determine if...
Virginia Department of Education
Linear Modeling
An inquiry-based algebra lesson plan explores real-world applications of linear functions. Scholars investigate four different situations that can be modeled by linear functions, identifying the rate of change, as well as the...
West Contra Costa Unified School District
Comparing Linear and Quadratic Functions
If a linear function and a quadratic function enter a boxing match, which one would win? Learners first review how to find key features of linear and quadratic functions. Next, they compare key features of pairs of functions.
University of Utah
Functions
Define, explore, compare, and analyze functions with the fourth chapter of a 10-part eighth-grade workbook series. After encountering the definition of a function, pupils begin to explore linear and nonlinear functions. They then...
University of Utah
Explore Proportional and Linear Relationships
Progress from proportional relationships to linear functions. Pupils first review concepts of proportionality covered in earlier grades. They then extend these concepts to linear functions, such as determining the slope of a...
Teach Engineering
Applications of Linear Functions
It's not so straightforward — lines can model a variety of applications. Pupils experience linear relationships within the context of science, including Hooke's and Ohm's Laws. Class members got a taste of motion and speed from the...
Flipped Math
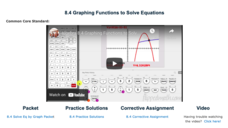
Graphing Functions to Solve Equations
Intersections become solutions. Scholars watch a video on using a graphing calculator to find the solution to an equation in one variable. While watching the presentation, pupils practice working some of the examples and compare their...
West Contra Costa Unified School District
Linear-Quadratic Systems
Why do I have to learn two different ways to solve linear-quadratic systems? Isn't one way enough? Learners first investigate the three possible situations for linear-quadratic systems (two, one, or zero solutions), then solve such...
College Board
Beginning the Year with Local Linearity
Local linearity isn't the first thing that comes to mind to start off an AP® Calculus course. A scholarly article discusses one possible beginning to the AP® Calculus course: investigating and introducing derivatives through activities...
National Council of Teachers of Mathematics
Geogebra: Residuals and Linear Regression
If the line fits, use it. Using a Geogebra interactive, pupils plot points and try to find the best fit line. They assess the linear fit by analyzing residuals. A radio button allows participants to show the regression line and the...
West Contra Costa Unified School District
Evaluating Functions
Functions as inputs for other functions? After reviewing function notation and how to input values to evaluate functions, class members input functions into functions, essentially determining the composition of functions.
West Contra Costa Unified School District
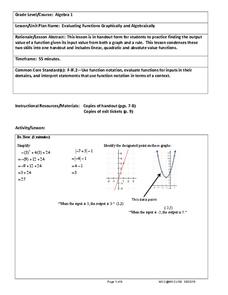
Evaluating Functions Graphically and Algebraically
High schoolers evaluate functions graphically and algebraically. After completing that step, they write a statement describing the input and output.
University of Utah
Representations of a Line
Line up to learn about lines! Scholars discover how to express patterns as linear functions. The workbook then covers how to graph and write linear equations in slope-intercept form, as well as how to write equations of...
Mathematics Vision Project
Quadratic Functions
Inquiry-based learning and investigations form the basis of a deep understanding of quadratic functions in a very thorough unit plan. Learners develop recursive and closed methods for representing real-life situations,...
Virginia Department of Education
Functions 1
Scholars learn what it means for a relation to be a function and see various representations of functions. After learning the definition, they participate in a card sorting activity classifying relations as functions or not.
CK-12 Foundation
Determining the Equation of a Line: Trip Functions
Let the function drive the activity. The interactive displays the odometer on a car for a trip. Pupils determine and interpret the slope of the situation. Then, they find a verbal description of the equation of the function.
Virginia Tech
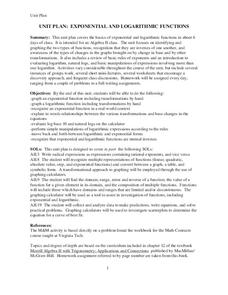
Unit Plan: Exponential and Logarithmic Functions
A six-day unit for algebra II on exponential and logarithmic functions builds upon Chapter 12 of Merrill Algebra II with Trigonometry; Applications and Connections. The text provides assistance in the depth of instruction...
CK-12 Foundation
Intercepts by Substitution: Finding a Linear Product Using a Quadratic
Discover another way to interpret multiplication. Using an interactive, learners slide points (representing the factors of multiplication) along the x-axis of the graph of y = x^2 and observe changes in the line segment connecting the...
Teach Engineering
Linear Regression of BMD Scanners
Objects may be more linear than they appear. Scholars investigate the relationship between the number of bone mineral density scanners in the US and time. Once they take the natural logarithm of the number of scanners, a linear...
EngageNY
Modeling a Context from a Graph
Collaborative pairs develop functions that model a graph from a context using the modeling cycle. They then analyze their function models in order to answer questions about the scenario.
Virginia Department of Education
Transformation Investigation
Graph it! Investigate transformations with a graphing calculator. Pupils graph sets of linear functions on the same set of axes. They determine how changes in the equation of a linear function result in changes in the graph.
Teach Engineering
Coordinates and the Cartesian Plane
The plot thickens to get a functional understanding. After a short review of plotting points on the coordinate plane, class members learn the difference between functions and relations in the second lesson in a series of nine. They...
American Statistical Association
What Fits?
The bounce of a golf ball changes the result in golf, mini golf—and a great math activity. Scholars graph the height of golf ball bounces before finding a line of best fit. They analyze their own data and the results of others to better...


