Scholastic
Study Jams! Function Tables
Each week Mia saves a certain portion of the earnings from her babysitting job. Help her figure out how much she can save this week with a step-by-step presentation on function tables. Given a set of inputs and outputs, the process for...
5280 Math
Factory Functions
Solve a real-life problem using function-building skills. Presented with an open-ended question, scholars complete a checklist to create and justify a solution in an interesting algebra project. The checklist asks for justifications of...
Mathematics Vision Project
Module 7: Modeling with Functions
The sky's the limit of what you create when combining functions! The module begins with a review of transformations of parent functions and then moves to combining different function types using addition, subtraction, and...
EngageNY
Four Interesting Transformations of Functions (Part 4)
What do you get when you cross piecewise functions with transformations? An engaging lesson! The conclusion of a four-part series on the transformations of functions asks class members to apply transformations to piecewise...
EngageNY
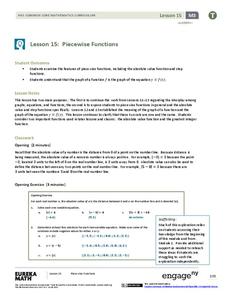
Piecewise Functions
Show your class members that if they can graph a linear function, they can graph an absolute value function. Groups create an absolute value graph using a table, then entertain the idea of an absolute value function defined as two...
EngageNY
Stretching and Shrinking Graphs of Functions
Why is that graph wider? Pupils learn about stretching and shrinking graphs of square root, absolute value, cubic, and quadratic functions. They study both vertical and horizontal stretches and shrinks in addition to reflections.
EngageNY
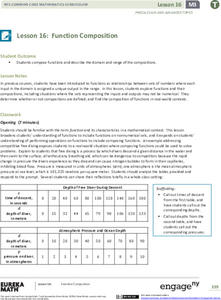
Function Composition
Combine functions for the first time. Pupils investigate composition of functions using a function table and then function machines in the 17th installment in a 23-part Precalculus series. Scholars learn the two notations for composition...
EngageNY
Four Interesting Transformations of Functions (Part 1)
Understanding how functions transform is a key concept in mathematics. This introductory lesson makes a strong connection between the function, table, and graph when exploring transformations. While the resource uses absolute value...
EngageNY
Comparing Linear and Exponential Models Again
Making connections between a function, table, graph, and context is an essential skill in mathematics. Focused on comparing linear and exponential relationships in all these aspects, this resource equips pupils to recognize and interpret...
EngageNY
Graphing the Tangent Function
Help learners discover the unique characteristics of the tangent function. Working in teams, pupils create tables of values for different intervals of the tangent function. Through teamwork, they discover the periodicity, frequency, and...
Mathematics Vision Project
Module 2: Linear and Exponential Functions
Write, graph, and model all things linear and exponential. Building on the previous module in a nine-part Algebra I series, learners compare linear exponential modeling. They write equations, graph functions, and analyze key features.
Mathematics Vision Project
Module 6: Quadratic Functions
Linear, exponential, now it's time for quadratic patterns! Learners build on their skills of modeling patterns by analyzing situations with quadratic functions. The sixth module in the Algebra I series has pupils analyze multiple...
EngageNY
Comparing Linear Functions and Graphs
How can you compare linear functions? The seventh installment of a 12-part module teaches learners how to compare linear functions whose representations are given in different ways. They use real-world functions and interpret features in...
Mathematics Vision Project
Module 8: Modeling With Functions
Sometimes there just isn't a parent function that fits the situation. Help scholars learn to combine function types through operations and compositions. Learners first explore a new concept with an introductory activity and then follow...
Mathematics Vision Project
Module 1: Functions and Their Inverses
Nothing better than the original! Help your class understand the relationship of an inverse function to its original function. Learners study the connection between the original function and its inverse through algebraic properties,...
Mathematics Vision Project
Module 5: Features of Functions
The language and features of functions get careful treatment in a complex but doable lesson. Learners get a lot of practice really figuring out what a graph means in context, and also identifying key features of graphs. Key ideas...
Mathematics Assessment Project
Representing Quadratic Functions Graphically
Sometimes being different is an advantage. An engaging activity has scholars match cards with quadratic functions in various forms. Along the way, they learn about how each form highlights key features of quadratic functions.
EngageNY
Interpreting Quadratic Functions from Graphs and Tables
Seeing functions in nature is a beautiful part of mathematics by analyzing the motion of a dolphin over time. Then take a look at the value of a stock and maximize the profit of a new toy. Explore the application of quadratics by...
West Contra Costa Unified School District
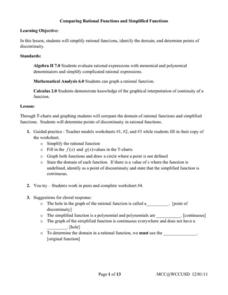
Comparing Rational Functions and Simplified Functions
What kind of functions have holes in their graphs? Here, the teacher guides the class on how to use the simplified function of a rational function to aid in the graphing of the original rational function. T-tables are used in order...
EngageNY
Graphing Cubic, Square Root, and Cube Root Functions
Is there a relationship between powers and roots? Here is a lesson that asks individuals to examine the graphical relationship. Pupils create a table of values and then graph a square root and quadratic equation. They repeat the process...
EngageNY
Comparing Quadratic, Square Root, and Cube Root Functions Represented in Different Ways
Need a real scenario to compare functions? This activity has it all! Through application, individuals model using different types of functions. They analyze each in terms of the context using the key features of the graphs.
EngageNY
Modeling a Context from a Verbal Description (part 1)
When complicated algebraic expressions are involved, it is sometimes easier to use a table or graph to model a context. The exercises in this lesson are designed for business applications and require complex algebraic...
EngageNY
The Height and Co-Height Functions of a Ferris Wheel
Show learners the power of mathematics as they model real-life designs. Pupils graph a periodic function by comparing the degree of rotation to the height of a ferris wheel.
Mathematics Vision Project
Module 3: Polynomial Functions
An informative module highlights eight polynomial concepts. Learners work with polynomial functions, expressions, and equations through graphing, simplifying, and solving.


