Teacherfiles
Portfolio Contents
Learners can create a portfolio in any class and use this handy table of contents to organize their work effectively. Individuals are asked to include their best work alongside work that demonstrates areas for progress. The table of...
EngageNY
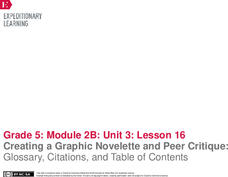
Creating a Graphic Novelette and Peer Critique: Glossary, Citations, and Table of Contents
A, B, C ... let's alphabetize to get organized! Using the informative resource, scholars create an alphabetized glossary of key words for their graphic novelettes. Additionally, they create a table of contents and citations page.
Mathed Up!
Two Way Tables
When presented with categorical data, a two-way frequency table is a great way to summarize the information. Pupils organize categorical data using a two-way table, then use the tables to determine missing data and to calculate simple...
American Chemical Society
The Periodic Table and Transuranium Elements
The periodic table has so much more to it than meets the uninformed eye. An inquiry-based lesson leads learners through the history of the discovery of several transuranium elements. They then use informational resources to build a...
Mathed Up!
Frequency Tables
The section of a larger General Certificate of Secondary Education math review requires pupils to summarize numerical data presented in a frequency table. Scholars determine the number of data points, the range, the mean, and the...
EngageNY
Summarizing Bivariate Categorical Data in a Two-Way Table
Be sure to look both ways when making a two-way table. In the lesson, scholars learn to create two-way tables to display bivariate data. They calculate relative frequencies to answer questions of interest in the 14th part of the series.
Curated OER
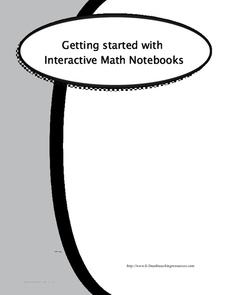
Getting Started with Interactive Math Notebooks
Set young mathematicians up for success with this interactive math notebook. Including a list of rules and expectations for using the notebooks, as well as templates for a creating a cover page and table of contents, this resource...
Inside Mathematics
Conference Tables
Pupils analyze a pattern of conference tables to determine the number of tables needed and the number of people that can be seated for a given size. Individuals develop general formulas for the two growing number patterns and use them to...
Library of Congress
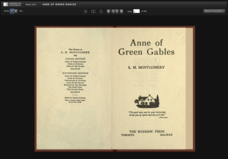
Anne of Green Gables
According to Anne with an E, "You can always nearly enjoy things if you make up your mind firmly that you will." An eBook version of Anne of Green Gables by L.M. Montgomery introduces readers to the classic text. The novel includes a...
CK-12 Foundation
CK-12 Earth Science Concepts for Middle School
Explore a variety of science concepts in an interactive textbook created for middle school scholars. A lengthy table of contents takes readers to pages comprised of a subject overview, outline, and summary. Follow links further to find...
Core Knowledge Foundation
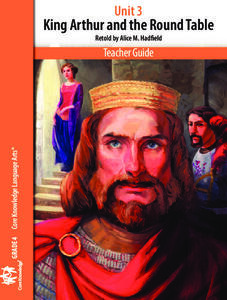
Unit 3: King Arthur and the Round Table
Over four weeks, fourth graders study King Arthur and the Round Table, retold by Alice M. Hadfield. Fifteen lessons take pupils through each chapter, complete word work, and the writing process to draft paragraphs, sentences, dialogue,...
Mathed Up!
Straight Line Graphs
Develop graphs by following the pattern. The resource provides opportunities for reviewing graphing linear equations. Pupils create tables to graph linear equations by using patterns whenever possible. The worksheet and video are part of...
Mathed Up!
Drawing Quadratic Graphs
Curve through the points. The resource, created as a review for the General Certificate of Secondary Education Math test, gives scholars the opportunity to refresh their quadratic graphing skills. Pupils fill out function tables to find...
California Education Partners
T Shirts
Which deal is best? Learners determine which of two companies has the best deal for a particular number of shirts. They begin by creating a table and equations containing each company's pricing structure. Individuals finish the seventh...
Noyce Foundation
Ducklings
The class gets their mean and median all in a row with an assessment task that uses a population of ducklings to work with data displays and measures of central tendency. Pupils create a frequency chart and calculate the mean and median....
Rice University
Introductory Statistics
Statistically speaking, the content covers several grades. Featuring all of the statistics typically covered in a college-level Statistics course, the expansive content spans from sixth grade on up to high school. Material comes from a...
University of Southern Indiana
Manifest Density
There's a lot content packed into the four lessons of this physical science unit on density. From salad dressing to the water cycle and hot air balloons, these lessons engage students in hands-on activities that explore real-world...
Greater Good Science Center
Nurturing Gratitude From the Inside Out: 30 Activities for Grades K–8
Teach the importance of showing gratitude at any age with a teacher's guide comprised of thirty activities. Browse the extensive table of contents to find the array of exercises designed to meet the needs of your learners. Scholars take...
Inside Mathematics
Sorting Functions
Graph A goes with equation C, but table B. The short assessment task requires class members to match graphs with their corresponding tables, equations, and verbalized rules. Pupils then provide explanations on the process they used to...
Mathed Up!
Frequency Polygons
Frequency polygons are a different way to represent frequencies over intervals. Pupils take frequencies for intervals of data from a frequency table and plot them as a frequency polygon. Budding mathematicians find information about the...
Mathematics Vision Project
Modeling Data
Is there a better way to display data to analyze it? Pupils represent data in a variety of ways using number lines, coordinate graphs, and tables. They determine that certain displays work with different types of data and use two-way...
Mathematics Vision Project
Module 9: Modeling Data
How many different ways can you model data? Scholars learn several in the final module in a series of nine. Learners model data with dot plots, box plots, histograms, and scatter plots. They also analyze the data based on the data...
Mathematics Vision Project
Features of Functions
What are some basic features of functions? By looking at functions in graphs, tables, and equations, pupils compare them and find similarities and differences in general features. They use attributes such as intervals of...
California Education Partners
Linflower Seeds
How does your garden grow? Use proportions to help Tim answer that question. By using their understanding of proportional relationships, pupils determine the number of seeds that will sprout. They create their own linear relationships...
Other popular searches
- Using Table of Contents
- Table of Contents Index
- Table of Contents Sheets
- Table of Contents Worksheets
- Using a Table of Contents
- Table of Contents and Index
- Table of Contents Learning
- Table of Contents Lessons
- Using the Table of Contents
- Table of Contents, Headings


