Mathematics Vision Project
Module 8: Modeling With Functions
Sometimes there just isn't a parent function that fits the situation. Help scholars learn to combine function types through operations and compositions. Learners first explore a new concept with an introductory activity and then follow...
Illustrative Mathematics
Graphing Rational Functions
The slider feature on Desmos excellently shows how graphs change based on different variable values. Learners look at two similar rational functions and compare and discuss what happens when the numbers go from positive to zero to...
Houghton Mifflin Harcourt
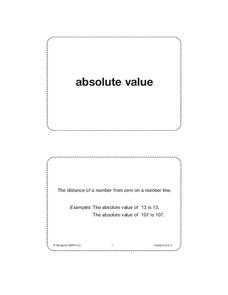
Unit 4 Math Vocabulary Cards (Grade 6)
Reinforce math vocabulary with a set of flash cards. Forty-eight cards offer boldly printed words, and their corresponding definition alongside an example with labels. Terms include absolute value, inverse operations, slope, and more!
EngageNY
More Examples of Functions
Discrete or not discrete? Individuals learn about the difference between discrete and non-discrete functions in the fourth installment of a 12-part module. They classify some examples of functions as being either discrete or non-discrete.
Mt. San Antonio Collage
Quiz 1: Types of Functions
Sometimes the best things are already done for you! Here is a six-problem quiz that has a variety of problems ranging from solving quadratic equations to interpreting a function. The piece-de-resistance is the worked out answer key in...
EngageNY
Representing, Naming, and Evaluating Functions (Part 2)
Notation in mathematics can be intimidating. Use this lesson to expose pupils to the various ways of representing a function and the accompanying notation. The material also addresses the importance of including a domain if necessary....
Mathematics Vision Project
Module 5: Features of Functions
The language and features of functions get careful treatment in a complex but doable lesson. Learners get a lot of practice really figuring out what a graph means in context, and also identifying key features of graphs. Key ideas...
Illustrative Mathematics
Graphs of Power Functions
There are parent functions, and then there are parent functions with a really interesting way to explore them. High schoolers are asked to graph different combinations of parent functions together and determine the point of...
Illustrative Mathematics
Building a Quadratic Function Form
A simple tweak in the equation can mean big things for a quadratic graph. High school mathematicians look at the parent graph of a quadratic and incorporate three different changes to the function. The problems require explanations of...
EngageNY
Graphs of Simple Nonlinear Functions
Time to move on to nonlinear functions. Scholars create input/output tables and use these to graph simple nonlinear functions. They calculate rates of change to distinguish between linear and nonlinear functions.
CK-12 Foundation
Graphs of Functions Based on Rules: Plotting Profits
Profit from this interactive on graphing and interpreting functions. An interactive allows learners to plot a square root function representing a company's profits. They answer some challenge questions that require interpreting this...
K20 LEARN
Transformers Parts 2-5 - Algebra 2 Parent Functions: Function Transformations
Dive into an activity that may cause a little reflection! Building from the first activity in the series of two, learners explore transformation using unfamiliar functions. The key takeaway is that applying transformations to any...
EngageNY
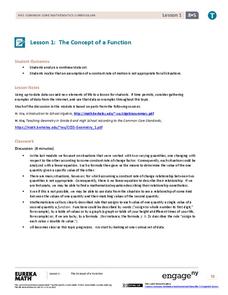
The Concept of a Function
Explore functions with non-constant rates of change. The first installment of a 12-part module teaches young mathematicians about the concept of a function. They investigate instances where functions do not have a constant rate of change.
Inside Mathematics
Functions
A function is like a machine that has an input and an output. Challenge scholars to look at the eight given points and determine the two functions that would fit four of the points each — one is linear and the other non-linear. The...
EngageNY
Graphs of Functions and Equations
Explore the graphs of functions and equations with a resource that teaches scholars how to graph functions as a set of input-output points. They learn how the graph of a function is the graph of its associated equation.
Scholastic
Study Jams! Function Tables
Each week Mia saves a certain portion of the earnings from her babysitting job. Help her figure out how much she can save this week with a step-by-step presentation on function tables. Given a set of inputs and outputs, the process for...
EngageNY
Relationships Between Quantities and Reasoning with Equations and Their Graphs
Graphing all kinds of situations in one and two variables is the focus of this detailed unit of daily lessons, teaching notes, and assessments. Learners start with piece-wise functions and work their way through setting up and solving...
EngageNY
Ferris Wheels—Using Trigonometric Functions to Model Cyclical Behavior
Have class members going in circles as they model the path of a Ferris Wheel using trigonometric functions. Building on the previous lesson plan in this series on transformations, learners use trigonometric functions to model wheels...
CK-12 Foundation
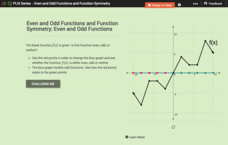
Even and Odd Functions and Function Symmetry: Even and Odd Functions
Even, odd, or neither? Pupils study even and odd functions using a well-balanced interactive. They determine whether a given function is even or odd from its graph.
EngageNY
Comparing Quadratic, Square Root, and Cube Root Functions Represented in Different Ways
Need a real scenario to compare functions? This lesson has it all! Through application, individuals model using different types of functions. They analyze each in terms of the context using the key features of the graphs.
Mathematics Vision Project
Module 6: Trigonometric Functions
Create trigonometric functions from circles. The first lesson of the module begins by finding coordinates along a circular path created by a Ferris Wheel. As the lessons progress, pupils graph trigonometric functions and relate them to...
EngageNY
Transforming the Graph of the Sine Function
Build a solid understanding of trigonometric transformations through exploration. Learners work in teams to analyze the effects of different algebraic components on the graph of a sine function.
EngageNY
Graphing the Tangent Function
Help learners discover the unique characteristics of the tangent function. Working in teams, pupils create tables of values for different intervals of the tangent function. Through teamwork, they discover the periodicity, frequency, and...
EngageNY
Stretching and Shrinking Graphs of Functions
Why is that graph wider? Pupils learn about stretching and shrinking graphs of square root, absolute value, cubic, and quadratic functions. They study both vertical and horizontal stretches and shrinks in addition to reflections.
