Flipped Math
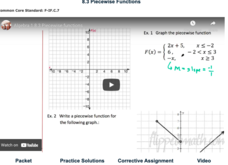
Piecewise Functions
Break it up into pieces to solve the problem. Individuals watch a video on how to graph and determine the equation and values of piecewise functions. Viewers then work several exercises to practice evaluating a piecewise function at...
Charleston School District
Sketching a Piecewise Function
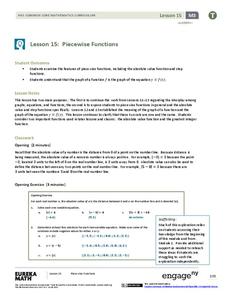
How do you combine linear and nonlinear functions? You piece them together! The lesson begins by analyzing given linear piecewise functions and then introduces nonlinear parts. Then the process is reversed to create graphs from given...
EngageNY
Piecewise Functions
Show your class members that if they can graph a linear function, they can graph an absolute value function. Groups create an absolute value graph using a table, then entertain the idea of an absolute value function defined as two...
Mt. San Antonio Collage
Test 1: Functions and Their Graphs
Save the time creating an assessment because these function problems should do the trick. With 10 multi-part questions, they each focus on a different topic including radical, polynomial, linear and piecewise functions. The majority of...
EngageNY
Increasing and Decreasing Functions 1
Model situations with graphs. In the fourth installment of a 16-part module, scholars learn to qualitatively analyze graphs of piecewise linear functions in context. They learn to sketch graphs for different situations.
Mathematics Vision Project
Module 8: More Functions, More Features
A piece of this and a piece of that, add domain restrictions and create a piecewise function. Young scholars explore piecewise functions with and without context. Functions include both linear and quadratic parts. The module is the...
Mathematics Vision Project
Features of Functions
What are some basic features of functions? By looking at functions in graphs, tables, and equations, pupils compare them and find similarities and differences in general features. They use attributes such as intervals of...
EngageNY
Relationships Between Quantities and Reasoning with Equations and Their Graphs
Graphing all kinds of situations in one and two variables is the focus of this detailed unit of daily lessons, teaching notes, and assessments. Learners start with piece-wise functions and work their way through setting up and solving...
Flipped Math
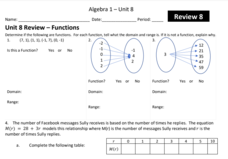
Unit 8 Review: Functions
Let's finish a functional review. Pupils work through 31 items to review the concepts learned in Unit 8. Scholars determine whether a mapping is a function and identify the domain and range. Using function notation, individuals then...
EngageNY
Analyzing a Graph
Collaborative groups utilize their knowledge of parent functions and transformations to determine the equations associated with graphs. The graph is then related to the scenario it represents.
University of North Texas
Reading Graphs
There is more to the eye than just a graph on paper. The presentation shows three different piecewise graphs and asks an assortment of questions. The resource includes topics such as domain and range, intervals of increasing and...
Mathematics Assessment Project
Representing Functions of Everyday Situations
Functions help make the world make more sense. Individuals model real-world situations with functions. They match a variety of contexts to different function types to finish a helpful resource.
EngageNY
Increasing and Decreasing Functions 2
Explore linear and nonlinear models to help your class build their function skills. In a continuation of the previous lesson, learners continue to analyze and sketch functions that model real-world situations. They progress from linear...
Mathematics Vision Project
Module 3: Features of Functions
Learn how to represent functions in multiple ways. Learners analyze functions as equations, graphs, and verbal descriptions. The analysis includes intercepts, behavior, domain, and range. The module of seven lessons makes up the third...
Mathematics Vision Project
Module 5: Features of Functions
The language and features of functions get careful treatment in a complex but doable lesson. Learners get a lot of practice really figuring out what a graph means in context, and also identifying key features of graphs. Key ideas...
EngageNY
Modeling a Context from a Graph
Collaborative pairs develop functions that model a graph from a context using the modeling cycle. They then analyze their function models in order to answer questions about the scenario.
Illustrative Mathematics
Bank Account Balance
Represent the ups and downs of a bank account. The two-part task points out that some types of graphs may better show discrete functions than others. Pupils analyze a graph on how well it represents the situation. They develop their own...
EngageNY
End-of-Module Assessment Task - Algebra 1 (Module 3)
Looking for higher-level thinking questions? This assessment provides questions that challenge young mathematicians to think and analyze rather than simply memorize. Topics include piecewise functions, linear modeling, exponential...
Radford University
Create A Ramp Design
Ramp up a design challenge. Class members design ramps to meet a client's requirements to comply with the American with Disabilities Act. The scholars create a scaled graph of their designs and determine the equations of the lines on...
Radford University
Skate Ramp
Going up and down makes a more exciting ride. Pupils recall what they know about continuity and limits of functions. Working in groups, classmates design a skateboard ramp that meets a given set of criteria, using at least three...
Flipped Math
Calculus AB/BC - Connecting Multiple Representations of Limits
It's time to put it all together. Viewers of an informative video learn to connect multiple representations of limits. Given algebraic, tabular, and graphical representations of a linear piecewise function, they determine whether a limit...
Concord Consortium
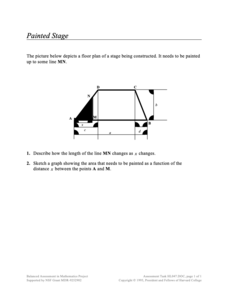
Painted Stage
Find the area as it slides. Pupils derive an equation to find the painted area of a section of a trapezoidal-shaped stage The section depends upon the sliding distance the edge of the painted section is from a vertex of the trapezoid....
Concord Consortium
Filling the Pool
Fill your mind with math as you think about filling a pool. Given information about the rates of two pipes, one filling a pool and one draining a pool, learners determine a piecewise function that models the volume of water in the pool...
Balanced Assessment
Postcards from the Falls
Pupils use graphs to analyze two pricing schemes for postcards. After determining which is the best deal, individuals determine what is wrong with the other pricing structures and explain their thinking.
