Florida Center for Reading Research
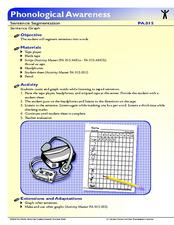
Phonological Awareness: Sentence Segmentation, Sentence Graph
Young scholars segment sentences while they listen to a series of sentences. Using a graph, pupils make a mark for each word they hear. Learners listen to each sentence three times; once to listen, once to mark, and once to check their...
CPO Science
Physics Skill and Practice Worksheets
Stop wasting energy searching for physics resources, this comprehensive collection of worksheets has you covered. Starting with introductions to the scientific method, dimensional analysis, and graphing data, these skills practice...
Scholastic
Study Jams! Bar Graphs
Mia teaches Sam how to create a bar graph, including forming a title, creating and labeling the axes, choosing a scale, and entering data. After viewing, data analysts can test themselves with seven follow-up questions and review...
US Department of Commerce
Looking at Numbers of Births Using a Line Graph
Was there a baby boom? Using census data, class members take a look at the number of 8-11 year olds and determine their birth years. Scholars create a double line graph to compare the number of births for two states for several years....
August House
Why Koala Has a Stumpy Tail
Learn about the animals of Australia with a language arts lesson about an Australian folktale called, Why Koala Has a Stumpy Tail. After reading the story as a class, kids discuss events and characters from the book, retell the...
Curated OER
Drive the Data Derby
Three days of race car design and driving through the classroom while guessing probability could be a third graders dream. Learn to record car speed, distances traveled, and statistics by using calculation ranges using the mean, median,...
Inside Mathematics
Vencent's Graphs
I like algebra, but graphing is where I draw the line! Worksheet includes three multiple-part questions on interpreting and drawing line graphs. It focuses on the abstract where neither axis has numbers written in, though both are...
Baylor College
Air: The Math Link
Inflate this unit on the science of air with these math skills practice and word problems. Accompanying the children's story Mr. Slaptail's Secret, this resource covers a wide range of math topics including the four basic...
Math Worksheets Land
Pie or Circle Graphs - Matching Worksheet
It's one thing to be able to read a pie graph, but it's another to analyze a pie graph and match it to its data table. Use a multiple choice instructional activity when challenging learners to practice this skill....
Computer Science Unplugged
The Poor Cartographer—Graph Coloring
Color the town red. Demonstrate the concept of graph theory with a task that involves determining the least number of colors needed to color a map so that neighboring countries are not represented by the same color. Pupils...
EngageNY
Comparing Linear Functions and Graphs
How can you compare linear functions? The seventh installment of a 12-part module teaches learners how to compare linear functions whose representations are given in different ways. They use real-world functions and interpret features in...
National Museum of the American Indian
The A:Shiwi (Zuni) People: A Study in Environment, Adaptation, and Agricultural Practices
Discover the connection of native peoples to their natural world, including cultural and agricultural practices, by studying the Zuni people of the American Southwest. This lesson includes examining a poster's photographs, reading...
Columbus City Schools
Speed Racers
Who wants to go fast? The answer? Your sixth-grade science superstars! The complete resource offers the ultimate, all-inclusive playbook for mastering the important concepts of speed versus time; distance versus time; and how...
Balanced Assessment
Movie Survey
Movie preferences will get your classes talking! Individuals read a pie graph and construct a bar graph using the same information. They then answer questions specific to the data and sample size.
Lied Center of Kansas
The Ugly Duckling and The Tortoise and the Hare
Both The Ugly Duckling and The Tortoise and the Hare are great additions to an elementary language arts lesson. Young readers focus on the literary elements of each story, including characters and plot development, and apply...
Baylor College
Living Things and Their Needs: The Math Link
Enrich your study of living things with these cross-curricular math activities. Following along with the story Tillena Lou's Day in the Sun, learners will practice addition and subtraction, learn how to measure volume and length,...
Mathematics Vision Project
Module 2: Systems of Equations and Inequalities
The brother-sister pair Carlos and Clarita need your class's help in developing their new pet sitting business. Through a variety of scenarios and concerns presented to the siblings, the learners thoroughly explore systems of equations...
Inside Mathematics
Sorting Functions
Graph A goes with equation C, but table B. The short assessment task requires class members to match graphs with their corresponding tables, equations, and verbalized rules. Pupils then provide explanations on the process they used to...
EngageNY
Geometric Interpretations of the Solutions of a Linear System
An intersection is more than just the point where lines intersect; explain this and the meaning of the intersection to your class. The 26th segment in a 33-part series uses graphing to solve systems of equations. Pupils graph linear...
Teach Engineering
Forms of Linear Equations
Linear equations are all about form. The fifth part in a unit of nine works with the different equivalent forms of linear equations. Class members become familiar with each form by identifying key aspects, graphing, and converting...
Inside Mathematics
Party
Thirty at the party won't cost any more than twenty-five. The assessment task provides a scenario for the cost of a party where the initial fee covers a given number of guests. The class determines the cost for specific numbers of guests...
Mathed Up!
Inequalities Regions
Discover how to solve systems of inequalities by graphing. An informative video shows pupils how to determine the solution set after graphing each inequality of a system. To finish, a worksheet gives them a chance to practice this skill.
Public Schools of North Carolina
Math Stars: A Problem-Solving Newsletter Grade 3
Make sure your class stays up with the times using this series of math newsletters. Including word problems that cover topics ranging from consumer math and symmetry to graphing and probability, these worksheets are a...
Teacher's Corner
Brandon's Baseball Collection
Ten questions make up a activity that challenges baseball enthusiasts to read a graph then answer questions pertaining to the data's range, mean, median, and mode.


