Scholastic
What's Your Angle?
Identifying types of angles meets real-world application in an excellent, hands-on geometry activity. Learners use pipe cleaners and a visual model to independently discover the acute, right, or obtuse angles in their classroom, which...
Curated OER
Venn Diagrams
The Venn diagram is such a useful tool! It can be used to provide a visual when comparing things across the curriculum. In this case, learners consider three Venn diagrams that each have a unique set of things in them. They must answer...
Curriculum Corner
Area and Perimeter
Get third graders excited to work find area and perimeter of unit squares, rectangles, and irregular shapes. A 36-page packet comes with task cards, graphic organizers, practice worksheets, printables with squares, exit tickets, and word...
Virginia Department of Education
Radical Equations
Provide students with the skill for how to examine algebraic and graphical approaches to solving radical equations. Learners solve various radical equations involving square root and cube root expressions. They first solve using...
K20 Learn
What Is It to Be Financially Literate?
New ReviewWhat does it mean to be financially responsible? Develop a working definition of financial literacy with your classes. Using six scenarios, learners debate financially literate actions and develop a definition based on their decisions.
Curated OER
Writing Takes Shape!
Students read The Greedy Triangle and discuss geometric solids. In this geometry lesson plan, students list the geo-solids in the world and create a graphic organizer to show where geo-solids exist.
West Contra Costa Unified School District
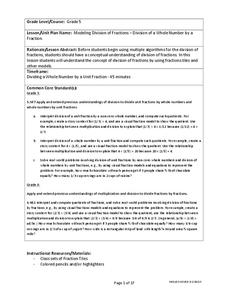
Modeling Division of Fractions
Introduce young mathematicians to the process of dividing fractions with a hands-on math lesson. Using the help of fraction strips and other visual models, children work through a series of example problems as they deepen their...
West Contra Costa Unified School District
Solving Radical Equations
How can you make solving radical equations more engaging? Provide your math class with a hands-on activity that focuses on solving radical equations with flash cards. A warm-up and exit ticket flank direct instruction of the steps...
EngageNY
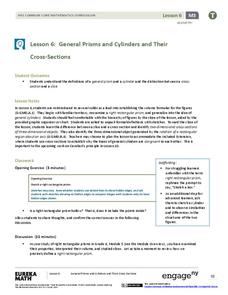
General Prisms and Cylinders and Their Cross-Sections
So a cylinder does not have to look like a can? By expanding upon the precise definition of a rectangular prism, the lesson develops the definition of a general cylinder. Scholars continue on to develop a graphical organizer for the...
EngageNY
Vectors in the Coordinate Plane
Examine the meaning and purpose of vectors. Use the lesson to teach your classes how find the magnitude of a vector and what it represents graphically. Your pupils will also combine vectors to find a resultant vector and interpret its...
EngageNY
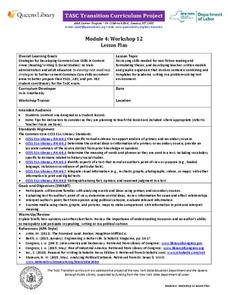
TASC Transition Curriculum: Workshop 12
How can opinions slant facts? Workshop participants learn how to examine primary and secondary sources and identify the author's point of view. They also examine how visual art impacts the meaning and rhetoric of sources. Full of...
Mathematics Vision Project
Module 2: Linear and Exponential Functions
Write, graph, and model all things linear and exponential. Building on the previous module in a nine-part Algebra I series, learners compare linear exponential modeling. They write equations, graph functions, and analyze key features.
Curriculum Corner
Standard and Word Form Match
Challenge mathematicians to match 18 standard form number cards to their corresponding word form card and record their pairs on a graphic organizer.
Curated OER
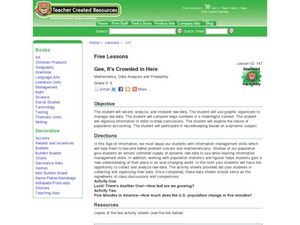
Gee, It's Crowded in Here
Students interpret raw data about population statistics. In this raw data lesson plan, students plug the data into graphic organizers and draw conclusions based on their findings.
EngageNY
Directed Line Segments and Vectors
Investigate the components of vectors and vector addition through geometric representations. Pupils learn the parallelogram rule for adding vectors and demonstrate their understanding graphically. They utilize the correct notation and...
Willow Tree
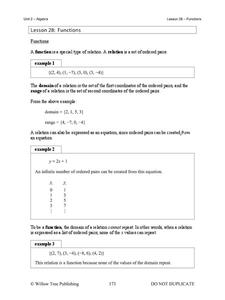
Functions
What makes a function a function? Learn the criteria for a relation defined as a function both numerically and graphically. Once young mathematicians define a function, they use function notation to evaluate it.
Mathematics Vision Project
Module 1: Functions and Their Inverses
Nothing better than the original! Help your class understand the relationship of an inverse function to its original function. Learners study the connection between the original function and its inverse through algebraic properties,...
Mathematics Vision Project
Module 4: Polynomial Functions
Bridge the gap between graphical and algebraic representations. Learners complete six lessons that begin by pointing out connections between the key features of a polynomial graph and its algebraic function. Later, pupils use the...
Curated OER
Beanbag Toss
In this problem solving worksheet, students examine the data presented in a graphic organizer and respond to s4 short answer math questions.
Curated OER
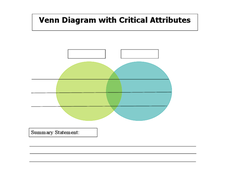
Venn Diagram with Critical Attributes
In this Venn diagram graphic organizer worksheet, students compare and contrast an item using the overlapping diagram. Students also list critical attributes in the space provided.
Curated OER
Two-Column Chart
In this two-column chart activity, students use the blank graphic organizer template as instructed by their teacher. This t-chart may be used for a variety of classroom activities.
Curated OER
Facts That Add to 4
In this addition instructional activity, students write addition sentences that equal 4. Students use the 5 spaces surrounding the number four in the center of the graphic organizer and create equations with 4 as the sum.
Curated OER
Facts That Add to 5
In this addition learning exercise, students write addition sentences that equal 5. Students use the 5 spaces surrounding the number four in the center of the graphic organizer and create equations with 5 as the sum.
Curated OER
Organizer for Fact Finding and Inferring from Visual Sources
In this graphic organizer fact finding and inferences instructional activity, students record details that they can see and prove as well as those that are inferences.
Other popular searches
- Biography Graphic Organizer
- Main Idea Graphic Organizers
- Vocabulary Graphic Organizer
- Story Map Graphic Organizer
- Science Graphic Organizers
- Setting Graphic Organizer
- Math Graphic Organizers
- 4 Square Graphic Organizer
- Sample Graphic Organizers
- Comic Book Graphic Organizer
- Graphic Organizer Legend
- Writing Graphic Organizers


