EngageNY
Graphs of Exponential Functions and Logarithmic Functions
Graphing by hand does have its advantages. The 19th installment of a 35-part module prompts pupils to use skills from previous lessons to graph exponential and logarithmic functions. They reflect each function type over a diagonal line...
EngageNY
When Can We Reverse a Transformation? 3
When working with matrix multiplication, it all comes back around. The 31st portion of the unit is the third lesson on inverse matrices. The resource reviews the concepts of inverses and how to find them from the previous two lessons....
EngageNY
Interpreting Correlation
Is 0.56 stronger than -0.78? Interpret the correlation coefficient as the strength and direction of a linear relationship between two variables. An algebra lesson introduces the correlation coefficient by estimating and then...
EngageNY
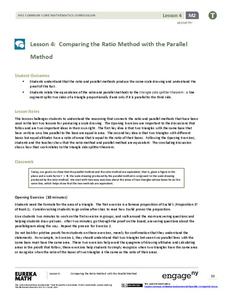
Comparing the Ratio Method with the Parallel Method
Can you prove it? Lead your class through the development of the Side Splitter Theorem through proofs. Individuals connect the ratio and parallel method of dilation through an exploration of two proofs. After completing the proofs,...
EngageNY
How Far Away Is the Moon?
Does the space shuttle have an odometer? Maybe, but all that is needed to determine the distance to the moon is a little geometry! The lesson asks scholars to sketch the relationship of the Earth and moon using shadows of an eclipse....
EngageNY
Construct an Equilateral Triangle (part 1)
Drawing circles isn't the only thing compasses are good for. In this first installment of a 36-part series, high schoolers learn how to draw equilateral triangles by investigating real-world situations, such as finding the location of a...
EngageNY
Logarithms—How Many Digits Do You Need?
Forget your ID number? Your pupils learn to use logarithms to determine the number of digits or characters necessary to create individual ID numbers for all members of a group.
EngageNY
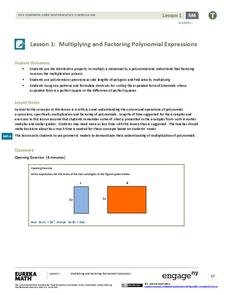
Multiplying and Factoring Polynomial Expressions (part 1)
Polynomial multiplication and factoring go hand in hand. Why not teach them together. This resource begins with an area model for distributing a monomial and then connects the process to factoring the GCF. Learners then advance to...
EngageNY
The Graph of the Natural Logarithm Function
If two is company and three's a crowd, then what's e? Scholars observe how changes in the base affect the graph of a logarithmic function. They then graph the natural logarithm function and learn that all logarithmic functions can be...
EngageNY
Composition of Linear Transformations 1
Learners discover that multiplying transformation matrices produces a composition of transformations. Using software, they map the transformations and relate their findings to the matrices.
EngageNY
Modeling with Quadratic Functions (part 2)
How many points are needed to define a unique parabola? Individuals work with data to answer this question. Ultimately, they determine the quadratic model when given three points. The concept is applied to data from a dropped...
EngageNY
Modeling with Quadratic Functions (part 1)
Relevance is key! The resource applies quadratic modeling by incorporating application of physics and business. Pupils work through scenarios of projectile motion and revenue/profit relationships. By using the key features of the graph,...
EngageNY
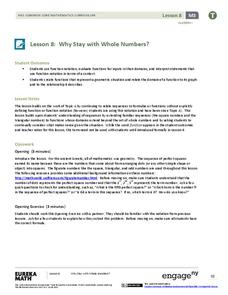
Why Stay with Whole Numbers?
Domain can be a tricky topic, especially when you relate it to context, but here is a lesson that provides concrete examples of discrete situations and those that are continuous. It also addresses where the input values should begin and...
EngageNY
Fundamental Theorem of Similarity (FTS)
How do dilated line segments relate? Lead the class in an activity to determine the relationship between line segments and their dilated images. In the fourth section in a unit of 16, pupils discover the dilated line...
EngageNY
Summarizing Bivariate Categorical Data in a Two-Way Table
Be sure to look both ways when making a two-way table. In the lesson, scholars learn to create two-way tables to display bivariate data. They calculate relative frequencies to answer questions of interest in the 14th part of the series.
EngageNY
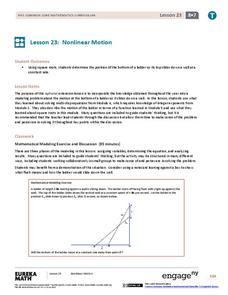
Nonlinear Motion
Investigate nonlinear motion through an analysis using the Pythagorean Theorem. Pupils combine their algebraic and geometric skills in the 24th lesson of this 25-part module. Using the Pythagorean Theorem, scholars collect data on the...
EngageNY
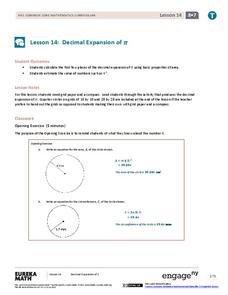
Decimal Expansion of Pi
Develop a better understanding of the value of pi. Learners explore the area of a circle using estimation and graph paper. While continuing to estimate the area of the circle using smaller and smaller grids, the number pi emerges.
EngageNY
Interpreting and Computing Division of a Fraction by a Fraction—More Models II
No more inverting and multiplying to divide fractions. Applying concepts of measurement division from the previous lesson, pupils consider partitive division using fraction bars and number lines. They first convert fractions to like...
Scholastic
Hopes and Dreams
A lesson encourages mini scholars in setting goals. Peers share their hopes and dreams and discuss how each one adds to everyone's unique character. Class members draw themselves in a scene achieving a goal. A follow-up meeting allows...
California Academy of Science
California's Climate
The United States is a large country with many different climates. Graph and analyze temperature and rainfall data for Sacramento and Washington DC as you teach your class about the characteristics of Mediterranean climates. Discuss the...
EngageNY
Distributions and Their Shapes
What can we find out about the data from the way it is shaped? Looking at displays that are familiar from previous grades, the class forms meaningful conjectures based upon the context of the data. The introductory lesson to...
EngageNY
Relationships Between Two Numerical Variables
Working in small groups and in pairs, classmates build an understanding of what types of relationships can be used to model individual scatter plots. The nonlinear scatter plots in this activity on relationships between two numerical...
EngageNY
Algebraic Expressions—The Commutative and Associative Properties
Who says math is boring? Turn dry concepts like properties and vocabulary into an interesting lesson! Examine the commutative and associative properties of addition and multiplication using geometric reinforcement. Through collaboration,...
EngageNY
Making Scale Drawings Using the Parallel Method
How many ways can you create a dilation? Many! Individuals strengthen their understanding of dilations by using various methods to create them. The new technique builds on pupils' understanding of the ratio method. Using the ratio,...
Other popular searches
- Teacher Resources
- Teacher Websites
- Substitute Teacher Resources
- Teachers in Space
- Teachers Sites
- Science Teacher Resources
- Substitute Teachers
- Teacher Education
- Teacher Resources Tenses
- Teacher Appreciation
- Math Teacher Resources
- Student Teacher


