Curated OER
Rates Of Change
High schoolers investigate the rate of change and how it effects a function over a given interval. They examine the slope of a line that is seccant and how it is compared to a tangent line and then determine the changes of a function at...
Curated OER
Slope & Rate of Change
This short handout addresses the concept of slope in two different ways: geometrically and analytically. Start with a brief description of slope, then use graphical representations to compare positive vs. negative slope and zero vs....
Curated OER
Taking Its Toll
Students explore ratios. In this rates lesson, students create a ratio to compare the price of a toll to the distance travelled. They compute the average cost per mile, determine the slope between two ordered pairs, and make...
Willow Tree
Line Graphs
Some data just doesn't follow a straight path. Learners use line graphs to represent data that changes over time. They use the graphs to analyze the data and make conclusions.
101 Questions
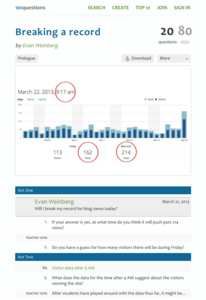
Breaking a Record
Can we break the record? Groups use provided data detailing the number of visitors to a blog to determine if the number of blog views breaks the previous record. They must take rates into consideration to make their estimates—a great...
Curated OER
Mini Examination #2 - Limits and Derivatives
In this limits and derivatives worksheet, students solve 18 multiple choice and short answer questions. Students find the limits and derivatives of functions.
Curated OER
AP Calculus
For this calculus worksheet, learners solve problems with trigonometric functions. They take the derivative and find the average rate of change.
Curated OER
Sandia Aerial Tram
Your learners analyze a table of real-life data in order to write an equation that best models the information. Exponential, quadratic, and linear rates of changes are all possibilities in this task.
Curated OER
Supplementary Related Rates Problems
In this rates worksheet, students read story problems, determine the necessary information, and set up equations to determine the velocity and rates. This two-page worksheet contains two multi-step story problems.
Curated OER
Time Changes Everything
Students analyze census data from 1915, 1967 and 2006. They read an article about how the world's population is growing at an alarming rate. They use primary source documents to create a timeline on the information they gathered. They...
Bowland
110 Years On
How many great, great grandchildren can one have? Scholars estimate the number of descendants a woman can have after 110 years. They use information about the average number of children per family and life expectancy to make this estimate.
Mathematics Common Core Toolbox
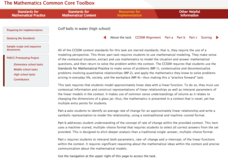
Golf Balls in Water
Here's a resource that models rising water levels with a linear function. The task contains three parts about the level of water in a cylinder in relationship to the number of golf balls placed in it. Class members analyze the data and...
Mascil Project
Drug Concentration
Different medications leave the body at different rates, and how people take them determines their effectiveness. Learners investigate this effectiveness by charting the concentration of a given medication in the body. Using exponential...
Curated OER
A Simple Model for Atmospheric Carbon Dioxide
In this atmospheric carbon dioxide worksheet, students use two diagrams to solve 6 problems about atmospheric carbon dioxide. One diagram shows the Keeling Curve and the other shows sources of carbon and the natural and anthropogenic...
Rice University
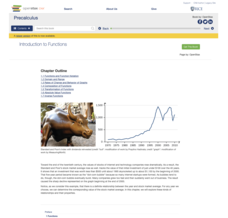
Precalculus
Take a step beyond Algebra 2. Learners use the eBook to learn concepts from the typical Precalculus course. Content starts off with a short review of functions in general and moves on to the basic functions, finishing up with more...
PBL Pathways
College Costs
Predict the year that college costs will double in your state using linear modeling. The first part of this two-part project based learning activity asks young mathematicians to use data from the College Board. They graph the data, write...
Mathematics Assessment Project
Functions
Studying function means more than simply learning a formula. Learners must use functions to think through four problems and find solutions. Each task utilizes a different concept from a study of functions. Class members might use a...
Mathematics Assessment Project
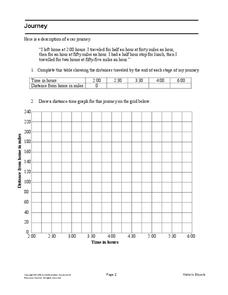
Journey
Drive home math concepts with an engaging task. Learners follow a verbal description to fill in a table and create a distance-time graph representing a car journey. They then answer questions by interpreting the graph.
EngageNY
Mid-Module Assessment Task: Grade 8 Module 6
Make sure pupils have the skills to move on to the second half of the module with a mid-module assessment task. The formative assessment instrument checks student learning before moving on to the rest of the lessons in the unit.
Curated OER
Extra Practice 11: Applications With Percents
For this percent worksheet, students read short stories, determine the information needed, write an algebraic equation and evaluate the problem. Problems include simple interest, sale price, and tax rates. There are nine percent problems...
101 Questions
Shower v. Bath
Which requires more water--a bath or a shower? Given some specific criteria, learners attempt to answer the question. A video shows how long it takes to fill a gallon container using a faucet and a shower head. Using that information and...
Curated OER
Earth's Warming Climate: Are We Responsible
Students examine the atmospheric data for CO2. In this web-based atmospheric instructional activity, student follow instructions to examine and plot on-line scientific data about the CO2 levels in our atmosphere and analyze the changes...
Curated OER
Mini Examination
Twelfth graders review the properties of derivatives without a calculator to get ready for their test. In this calculus lesson, 12th graders review average rate change, parametric equations, a line tangent to a curve, quotient rule, and...
Curated OER
Test on sections 6.2-6.3
Twelfth graders review the properties of derivatives without a calculator to get ready for their test. In this calculus lesson, 12th graders review average rate change, parametric equations, a line tangent to a curve, quotient rule, and...


