Curated OER
Math Mammoth End of the Year Test - Grade 3
In this comprehensive diagnostic test worksheet, learners examine, study, calculate and solve 38 math problems. They work with a variety of basic math concepts and word problems.
Curated OER
Wacky Water World: Student Worksheet
This well-designed math activity invites learners to work in pairs in order to determine which plan is the better value when going to an amusement park. Plan A and Plan B each have different admission fees, and different rates per ride....
Curated OER
Compounding with 100% Interest Rates
Your young economists will be amazed at the effect of compounding interest more frequently in this collaborative task about making sound financial choices. Learners are walked through the calculations of a couple of examples and then...
Curated OER
Energy Audit
Students collect data about energy usage and use mathematical calculations to analyze their data. In this energy conservation and statistics math lesson plan, students survey their homes to complete an energy usage worksheet. Students...
Federal Reserve Bank
GDP: Does It Measure Up?
Here is resource that offers a very clear explanation for how economists measure economic growth by comparing real GDP over time. There is also an additional activity that details the expenditure method and four components for...
Teach Engineering
Solar Power
How much solar energy is available at my location? An engaging resource provides a presentation along with script to give the class background information on determining solar radiation. Pupils then work through a worksheet to...
EngageNY
Sampling Variability
Work it out — find the average time clients spend at a gym. Pupils use a table of random digits to collect a sample of times fitness buffs are working out. The scholars use their random sample to calculate an estimate of the mean of the...
Teach Engineering
Start Networking!
Class members create their own social networks by collecting signatures before graphing the interactions with their fellow classmates. The degree distribution of the simulated social network is determined by calculating the degree of...
National Research Center for Career and Technical Education
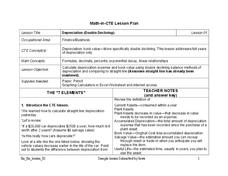
Depreciation (Double Declining)
Have you ever been told that your new car begins to lose its value as soon as you drive it off the lot? Aspiring accountants take on the concepts of depreciation and book value through an easy-to-deliver career and technology lesson. The...
Teach Engineering
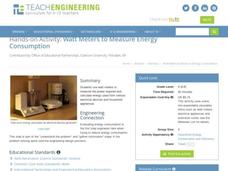
Watt Meters to Measure Energy Consumption
It used watt amount of energy? This resource investigates the power usage of small household appliances. Using a watt meter, groups measure the actual wattage used by an appliance and then calculate the energy used daily.
Teach Engineering
Measuring Viscosity
Groups use a marble to determine the viscosity of household fluids. The procedure calls for pupils to measure the amount of time it takes a marble to fall a specified distance in the fluids. Using unit conversions and algebra, the teams...
Teach Engineering
Machines and Tools (Part 2)
Which pulley system will give us a whale of a good time? Teams compare the theoretical and actual mechanical advantages of different pulley systems. They then form a recommendation for how to move a whale from an aquarium back to the ocean.
National Institute of Open Schooling
Chemical Arithmetics
Substances with the same empirical and molecular formula must be differentiated by their structural formula. Part two in a series of 36 has pupils using chemical formulas to calculate how much of a compound is present in a given...
Georgia Department of Education
Math Class
Young analysts use real (provided) data from a class's test scores to practice using statistical tools. Not only do learners calculate measures of center and spread (including mean, median, deviation, and IQ range), but...
Glynn County School System
Light, History, Gravity, Distance, Relativity, and Space-Time
Let the star's color be the guide! The color of a star indicates its temperature and its mass and distance affect the gravitational force. The lesson presentations address these concepts as well as how the theory of special relativity...
Chymist
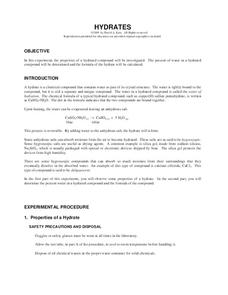
Hydrates
What occurs when a hydrate is heated? Lead your class in exploring the answer to this question as they investigate the properties of a hydrated compound. They heat copper(II) sulfate pentahydrate and evaporate the water...
101 Questions
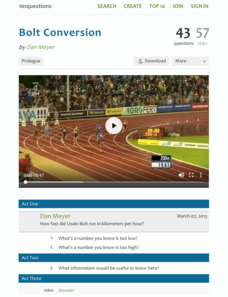
Bolt Conversion
Usain Bolt and Superman have something in common—speed! A video of one of Bolt's races introduces young scholars to the concept of unit rate. Using data from the race, the narrator calculates a unit rate in kilometers per hour, which...
National Wildlife Federation
Who Is Faster?
Am I going to catch it? Individuals time how long it takes them to walk, jog, and run a given distance and calculate their speed. They then research two animals and find their speeds. Using a chart, pupils compare the speeds of the...
Curated OER
Calculator Activity: Time Flies
In this skip count learning exercise, students use a calculator to help them skip count starting with the given time and finishing 60 minutes later.
Curated OER
Math Review: Estimation, Missing Numbers, Precise Calculations
In this math review learning exercise, students solve 30 problems that pertain to estimation, Roman numerals, elapsed time, precise calculations of multiplication and division.
Curated OER
Time Word Problems
In this time word problems worksheet, students solve 14 problems in which elapsed time is calculated. Students may also need to word backwards to determine starting times.
Curated OER
Labeling a Map of the British Isles and Elapsed Time
In this map work and elapsed time worksheet, students label England, Scotland, Wales, and Ireland on a map. They calculate the elapsed time of a delivery that is described in a word problem that is broken down into four parts.
Curated OER
Count Down the Days to a Special Event
Students calculate time using a grade appropriate skill. In this time lesson, students calculate the time to a special event. Students calculate days, months, weeks, hours, minutes or seconds depending on their skill level....
Curated OER
Probability Experiment Simulation: Design and Data Analysis Using a Graphing Calculator
Seventh graders simulate probability experiments. Using a graphing calculator, 7th graders design, conduct, and draw conclusions from simulations or probability experiments. Students construct frequency tables and compare the...
Other popular searches
- Calculating Time Zones
- Calculating Time and Motion
- Calculating Time Lesson
- Calculating Time Manually


