Curated OER
Piecewise Linear Functions: Extending Stories to Graphs
Using this resource, scholars develop graphs that model situations by showing change over time. They answer 15 questions based on information from charts that show growth in weight. They extend the concepts to an assessment section of...
West Contra Costa Unified School District
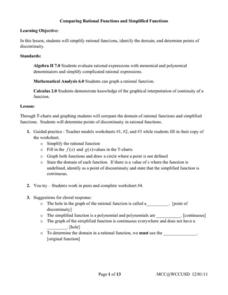
Comparing Rational Functions and Simplified Functions
What kind of functions have holes in their graphs? Here, the teacher guides the class on how to use the simplified function of a rational function to aid in the graphing of the original rational function. T-tables are used in order to...
Virginia Department of Education
Functions 1
Scholars learn what it means for a relation to be a function and see various representations of functions. After learning the definition, they participate in a card sorting activity classifying relations as functions or not.
Charleston School District
Graphing Functions
How do letters and numbers create a picture? Scholars learn to create input/output tables to graph functions. They graph both linear and nonlinear functions by creating tables and plotting points.
Curated OER
Algebra: Variable and Functions (Homework 21.4)
In this algebra worksheet, students complete 4 function tables. Students plug in the different values for x to complete the y sides of the charts.
Curated OER
Regents High School Examination PHYSICAL SETTING CHEMISTRY 2007
The University of the State of New York has designed a series of exams to be given to high schoolers. This chemistry exam is one of the most comprehensive and well-written that you will ever find. It consists of 84 questions in a variety...
Curated OER
Using Data Analysis to Review Linear Functions
Using either data provided or data that has been collected, young mathematicians graph linear functions to best fit their scatterplot. They also analyze their data and make predicitons based on the data. This lesson plan is intended as a...
Curated OER
Graphing of Functions Using First and Second Derivatives
In this calculus activity, students solve problems using the first and second derivatives. They define the behavior of the function based on the derivative. There are 11 questions with an answer key.
Curated OER
Exploring Exponential Growth and Decay Functions
Students differentiate between exponential growth and decay. For this algebra lesson, students solve exponential equations using properties of exponents. They use the Ti calculator to graph and analyze their functions.
Curated OER
Equal Factors Over Equal Intervals
Exponential functions and their growth rates are explored concretely using tables in a collaborative task. Then the successive quotient is explored algebraically.
National Research Center for Career and Technical Education
Business Management and Administration: Compound Interest - A Millionaire's Best Friend
Many math concepts are covered through this resource: percentages, decimals, ratios, exponential functions, graphing, rounding, order of operations, estimation, and solving equations. Colorful worksheets and a link to a Google search for...
Curated OER
In and Out Function Problems
Third graders solve In and Out function problems. They analyze a chart and discuss the steps to solving the functions, and discuss the patterns and complete the charts. Students then create a book of repeating patterns using magazines,...
Curated OER
Using Graphs and Charts
Students complete T charts and manipulate numbers using graphs and charts. For this math graphs and charts lesson, students review the concepts of pattern and function. Students then complete practice pages where they manipulate numbers...
Curated OER
VARIABLES AND PATTERNS, USE AFTER INVESTIGATION THREE. DISCRETE OR CONTINUOUS LINEAR RELATIONS.
Students discover for which kind of linear function is appropriate to use the "scatter" or the "connected" term. In this lesson, students investigate functions using variables, patterns book, graph paper, rulers and the graphit program.
Curated OER
The Function Box
Students explore arithmetic and numerical patterns. After observing a teacher created function box, students describe a pattern and predict what will "come out" of the function box. They explore patterns such as geometric shapes,...
Curated OER
Functions of Triangles
In this math learning exercise, students find the functions for each of the triangles. Then they determine the reference angles from standard position.
Curated OER
Linear Functions
Students solve and graph linear equations. In this algebra instructional activity, students collect data and plot it to create a linear function. They identify the domain and range of each line.
Curated OER
Chart Making for Navigators
Students discuss the importance and function of nautical maps for sailors. They, in groups, take soundings of a simulated bay in a shoebox and develop a nautical chart that enable them to navigate the shoebox safely.
Curated OER
Charting and Graphing Sales
Students analyze graphs, charts and tables. In this data analysis instructional activity, students practice creating and analyzing charts, graphs and tables corresponding to sales and surveys. This instructional activity uses data...
Curated OER
Algebra: Variables and Functions
In this algebra worksheet, students complete 10 function tables in which values for x are plugged in to an equation and the value of y is determined. There are no examples.
Curated OER
The Great Pollinators
Students discover the reproductive parts of a plant. In this biology lesson, students identify and categorize several different plants they dissect in class. Students record their information using a data chart.
Curated OER
Mind Mapping
Students explore the functions of the brain. They create their own "live" model comparing a phrenology chart to our modern understanding of brain function and anatomy. Students compare and contrast brain models.
Virginia Department of Education
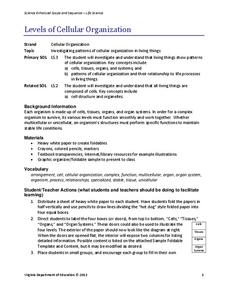
Levels of Cellular Organization
What an eccentric way to learn about each level of cellular organization! Allow emerging biologists to utilize white paper and create their own foldable charts to describe each level of organization in the body. You may also adapt the...
Curated OER
What's My Function?
Students use input / output tables to help them solve algebraic equations. They use patterns and relations to represent and analyze mathematical situations using algebraic symbols.


