Illustrative Mathematics
Weather Graph Data
Teaching young mathematicians about collecting and analyzing data allows for a variety of fun and engaging activities. Here, children observe the weather every day for a month, recording their observations in the form of a bar graph....
Teach Engineering
Backyard Weather Station
Challenge young meteorologists to apply their knowledge of weather to build their own weather stations. The resource provides the directions to build a weather station that contains a wind vane, barometer, thermometer, and rain...
NASA
The Types of Clouds and What They Mean
Learn to forecast the weather using cloud types. Budding meteorologists identify cloud types and learn to use a dichotomous key. As scholars develop observation and identification skills, they discover how different cloud types cause...
Curated OER
Using Vegetation, Precipitation, and Surface Temperature to Study Climate Zones
Using NASA's Live Access Server, earth scientists compare the temperature, precipitation, and normalized difference vegetation index for four different locations. They use the data to identify the climate zone of each location using...
NASA
Erosion and Landslides
A professional-quality PowerPoint, which includes links to footage of actual landslides in action, opens this moving instructional activity. Viewers learn what conditions lead to erosion and land giving way. They simulate landslides with...
US Environmental Protection Agency
Weather and Climate: What's the Difference?
Future weather forecasters collect daily temperatures over a period of time. Afterward, they compare their data with monthly averages, as researched on national weather websites, in order to grasp the difference between weather and...
NOAA
How Do We Know?: Make Additional Weather Sensors; Set Up a Home Weather Station
Viewers learn about three different weather measurement tools in installment five of the 10-part Discover Your Changing World series. They build weather vanes to collect data on wind speed, barometers to determine air pressure, and...
NOAA
Climate, Weather…What’s the Difference?: Make an Electronic Temperature Sensor
What's the best way to record temperature over a long period of time? Scholars learn about collection of weather and temperature data by building thermistors in the fourth installment of the 10-part Discover Your Changing World series....
Museum of Science
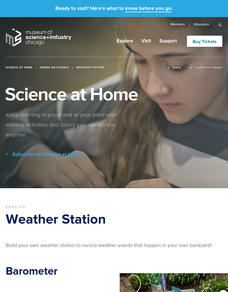
Weather Station
Find out what it is like outside before braving the elements. Teachers follow directions to build a barometer, rain gauge, and anemometer. Class members use the built weather instruments along with a thermometer to record weather...
American Museum of Natural History
Make Your Own Weather Station
Scholars build a weather station equipped with a wind vane, rain gauge, and barometer. Following an informative page about the weather, learners follow steps to build their pieces then turn into meteorologists to chart the weather they...
PBS
Twirling in the Breeze
Blow classes away with a hands-on lesson investigating wind speed. Learners use common materials to design and construct anemometers. They then test their anemometers and collect data on the wind speed created by a fan.
Curated OER
Tracking Local Weather
In this activity, studens will use different types of weather gauges and track the local weather for a week. After the week is over, students will collect their samples, analyze the data, and compare their conclusions to local weather...
US Environmental Protection Agency
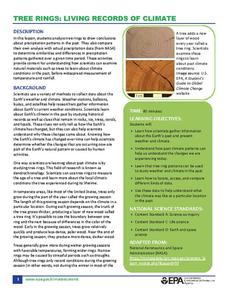
Tree Rings: Living Records of Climate
Open with a discussion on weather and climate and then explain how tree rings can provide scientists with information about the earth's past climate. Pupils analyze graphics of simulated tree rings from various US locations for the...
Illustrative Mathematics
Telling a Story With Graphs
Turn your algebra learners into meteorologists. Students are given three graphs that contain information about the weather in Santa Rosa, California during the month of February, 2012. Graph one shows temperatures, graph two displays the...
Curated OER
Project Helping Hands
Students work as a team to help improve the quality of life in rural Africa and develop a plan how to spend grant money the United Nations has provided them with.
Scholastic
Scholastic: Gather Data: Experiment With Weather
Simple guidelines for building several weather-related tools: anemometer, wind vane, barometer, rain gauge, snow gauge, and thermometer. After building your tools, follow experiment steps and record your findings on the Scholastic...
Science Buddies
Science Buddies: Using Weather Balloon Data to Map Atmospheric Temperature
Snow-capped mountains make a picturesque scene, especially in summertime when the peaks are in such contrast to the warmth below. This project shows you a way to see how temperature changes with altitude using data collected twice daily...
NOAA
Noaa: Be a Citizen Weather Reporter [Pdf]
Report the local weather to your community after deciding which data to collect and reading some of the National Weather Service's forecasting tips for amateur weather reporters.
Texas Instruments
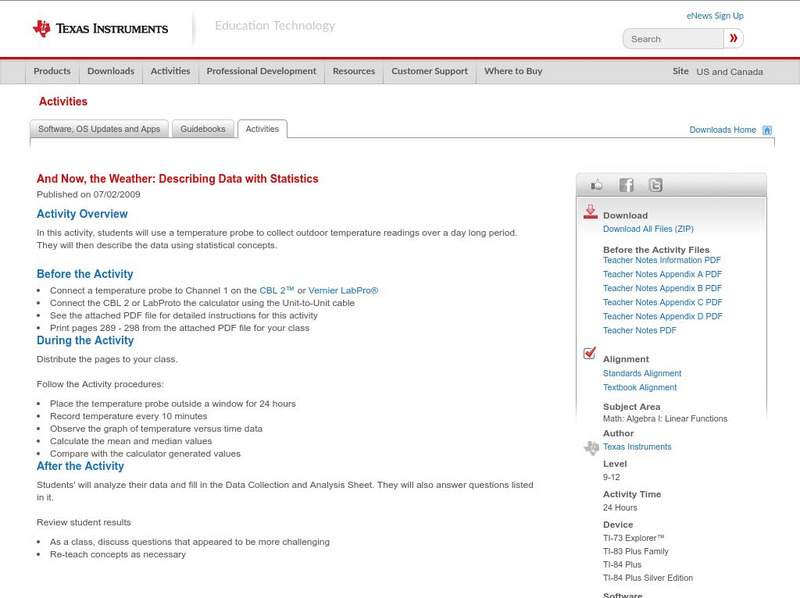
Texas Instruments: And Now, the Weather: Describing Data With Statistics
In this activity, students can use a temperature probe to collect outdoor temperature readings over a day long period. They will then describe the data Using statistical concepts.
NOAA
Noaa: Build Your Own Weather Station [Pdf]
Build six different instruments to collect meteorological data for the weather in your area.
Center for Innovation in Engineering and Science Education, Stevens Institute of Technology
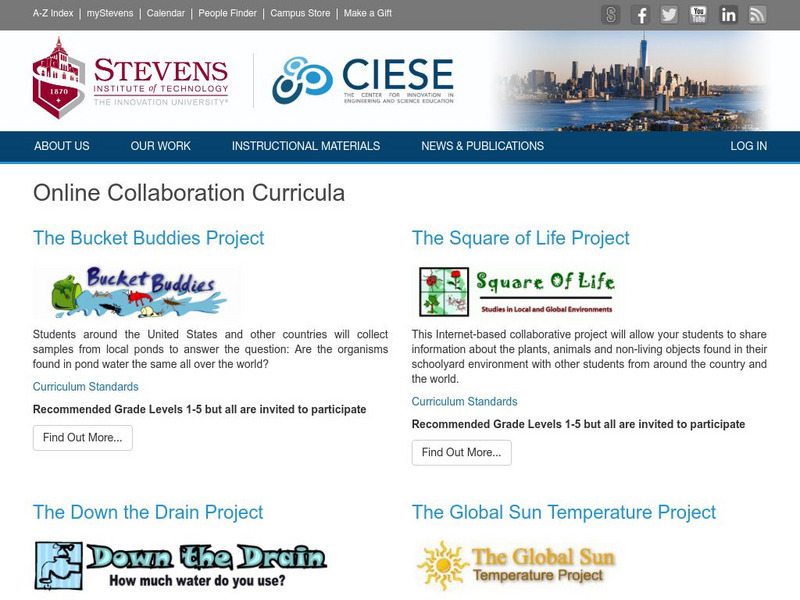
Ciese: Collaborative Projects
Using a variety of science topics, these projects link your class with classes around the world in data collection and analysis. There are projects recommended for all grade levels. Begin dates and end dates are listed to help in...
American Geosciences Institute
American Geosciences Institute: Earth Science Week: The Earth Trek Gravestone Project
The Gravestone Project, part of the global citizen science program called EarthTrek, seeks volunteers to visit cemeteries around the world and collect scientific data on how marble gravestones are weathering.
Texas Instruments
Texas Instruments: Sunrise, Sunset: Weather Match
Students determine the relationship between temperature and light intensity. They use a Temperature Sensor and a Light Intensity Sensor to collect temperature and light intensity data for a period of 24 hours. They understand the effect...
The Franklin Institute
Franklin Institute Online: Make Your Own Rain Gauge
Make a simple rain gauge to measure the precipitation.






![Noaa: Be a Citizen Weather Reporter [Pdf] Activity Noaa: Be a Citizen Weather Reporter [Pdf] Activity](https://d15y2dacu3jp90.cloudfront.net/images/attachment_defaults/resource/large/FPO-knovation.png)
