CK-12 Foundation
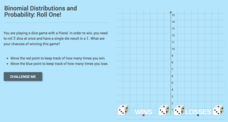
Binomial Distributions and Probability: Roll One!
It takes exactly one to win. Pupils calculate the probability of rolling five dice and having only a single die come up with a one. Learners calculate the number of expected wins out of a series of games. The interactive provides...
Curated OER
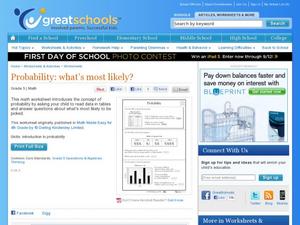
Probability: What's Most Likely?
Work with graphs, tally marks, and probability. Fifth graders read tables with different sets of data, including tally marks and a bar graph, to answer five questions. Use this worksheet as part of a probability lesson, or as a homework...
Curated OER
Shake It Up with Scatterplots
Students identify how to use a scatterplot to compare two sets of data to determine if they are related. Then they identify and describe the definition of regression line (the "line of best fit"). Students also identify how scientists...
Center Science Education
Weather and Climate Data Exploration
Access local temperature data online, graph averages, and critique it. Learners listen to a scenario where weather and climate are confused, and then answer questions to differentiate the two. The lesson itself is compact, but there is a...
Curated OER
1492: Using Data to Explain a Journey
Students examine how Christopher Columbus made his way across the Atlantic. In this data lesson students use an Internet program to navigate like Columbus.
Virginia Department of Education
Box-and-Whisker Plots
The teacher demonstrates how to use a graphing calculator to create box-and-whisker plots and identify critical points. Small groups then create their own plots and analyze them and finish by comparing different sets of data using box...
Statistics Education Web
How High Can You Jump?
How high can your pupils jump? Learners design an experiment to answer this question. After collecting the data, they create box plots and scatter plots to analyze the data. To finish the instructional activity, they use the data to...
EngageNY
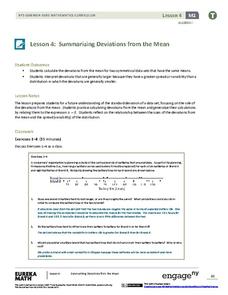
Summarizing Deviations from the Mean
Through a series of problems, learners determine the variability of a data set by looking at the deviations from the mean. Estimating means of larger data sets presented in histograms and providing a way to calculate an estimate round...
American Statistical Association
How Fast Are You?
Quick! Snap up the lesson. Scholars first use an online app to collect data on reaction times by clicking a button when the color of a box changes. They then plot and analyze the data by considering measures of center, measures of...
American Statistical Association
EllipSeeIt: Visualizing Strength and Direction of Correlation
Seeing is believing. Given several bivariate data sets, learners make scatter plots using the online SeeIt program to visualize the correlation. To get a more complete picture of the topic, they research their own data set and perform an...
Workforce Solutions
Miniature Gulf Coast Project
Scholars show what they know about data collection and analysis with an activity that examines a smaller population of Houghton, Texas. Independently or in pairs, learners identify their research question, gather, graph, and analyze...
Statistics Education Web
NFL Quarterback Salaries
Use statistics to decide if NFL quarterbacks earn their salaries! Learners study correlation coefficients after using technology to calculate regression equations. Through the data, they learn the meaning of correlation and correlation...
Los Angeles County Office of Education
Assessment for the California Mathematics Standards Grade 1
Here is an assessment designed to test mathematicians' knowledge of writing numbers, comparing numbers, skip counting, solving addition and subtraction problems; along with measuring objects, telling time, identifying shapes, reading...
Education Development Center
Interpreting Statistical Measures—Class Scores
Explore the effect of outliers through an analysis of mean, median, and standard deviation. Your classes examine and compare these measures for two groups. They must make sense of a group that has a higher mean but lower median compared...
Mathematics Assessment Project
Generalizing Patterns: The Difference of Two Squares
After completing an assessment task where they express numbers as the difference of squares (i.e., 9 = 5^2 – 4^2), class members note any patterns that they see in the problems.
Virginia Department of Education
Analyzing and Interpreting Statistics
Use measures of variance to compare and analyze data sets. Pupils match histograms of data sets to their respective statistical measures. They then use calculated statistics to further analyze groups of data and use the results to make...
Curated OER
What's Your Shoe Size? Linear Regression with MS Excel
Learners collect and analyze data. For this statistics lesson, pupils create a liner model of their data and analyze it using central tendencies. They find the linear regression using a spreadsheet.
Beyond Benign
Can You Hear Me Now? Cell Phone Accounts
How sustainable are cell phones? Throughout the unit, learners explore the issues around cell phones concerning sustainability. Class members take a graphical look at the number of cell phones across the world using a box-and-whisker...
Curated OER
A Day at the Beach
Help learners determine the rate of change for the temperature of sand. They will collect data on the temperature of wet and dry sand over time with a heat lamp overhead. Then make a scatter plot of the data and find a linear model to...
American Statistical Association
Tell it Like it is!
Scholars apply prior knowledge of statistics to write a conclusion. They summarize using correct academic language and tell the story of the data.
EngageNY
The Difference Between Theoretical Probabilities and Estimated Probabilities
Flip a coin to determine whether the probability of heads is one-half. Pupils use simulated data to find the experimental probability of flipping a coin. Participants compare the long run relative frequency with the known theoretical...
Fluence Learning
Writing About Literary Text: Pygmalion and Galatea
Is it crazy to fall in love with your own work, or is that the purest love of all? Compare two renditions of the classic Greek myth Pygmalion and Galatea with a literary analysis exercise. After students compare the similarities and...
California Education Partners
T Shirts
Which deal is best? Learners determine which of two companies has the best deal for a particular number of shirts. They begin by creating a table and equations containing each company's pricing structure. Individuals finish the seventh...
World History Digital Education Foundation, Inc.
COVID-19: Comparison with the Influenza Pandemic of 1918
A timely lesson uses documentation from the Spanish influenza pandemic of 1918 to compare it to the COVID-19 pandemic in 2020. Scholars watch a short video, analyze sources, complete a worksheet, and write a claim with supporting...


