Curated OER
Adaptations to Niches and Habitats
Life science learners measure and record traits of seeds, leaves, and their own hands and then graph the data to find a continous distribution curve. They compare and color diagrams of seven different animals' forelimbs (not included),...
Curated OER
Linear and Quadratic System
Learners find the common point of a linear and quadratic system given a graph of the system. Then they find a specific point located only on the parabola.
Illustrative Mathematics
Walk-a-thon 2
During a walk-a-thon your learners must determine the walking rate of Julianna's progress. Using tables, graphs, and an equation, they must be able to calculate the time it took her to walk one mile and predict her distance based on the...
Geophysical Institute
Latitude and Longitude with Google Earth
Travel the world from the comfort of your classroom with a lesson that features Google Earth. High schoolers follow a series of steps to locate places all over the earth with sets of coordinates. Additionally, they measure the distance...
Curated OER
Slope-Intercept Form of a Line
Using the subscriber website Explorelearning.com, young mathematicians observe changes in the slope and y-intercept and their effect on the graph of lines. This activity helps learners develop an intuitive sense of the connection between...
Illustrative Mathematics
Coffee by the Pound
This is a great exercise in graphing proportional quantities to interpret the unit rate as the slope of a graph. It is not easy for learners to understand what a unit rate is. When it is presented as the slope of a linear line graph,...
Curated OER
Introduction to Flight: A Math, Science and Technology Integrated Project
Seventh graders review graphing procedures and practice locating points using x,y coordinates. Students calculate the areas of the top and bottom surfaces of the airfoil. They construct a test model of the airfoil.
EngageNY
Analyzing Residuals (Part 1)
Just how far off is the least squares line? Using a graphing calculator, individuals or pairs create residual plots in order to determine how well a best fit line models data. Three examples walk through the calculator procedure of...
Illustrative Mathematics
The Circle and The Line
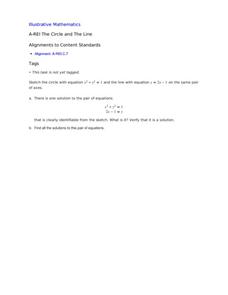
Here is a resource where algebra learners show their understanding of a system of equations involving a circle and a line. Once graphed, learners see two points of intersection, one where the ordered pair is read, and a second where...
Alabama Learning Exchange
Bloodstain Pattern Doesn't Lie......
An interesting instructional activity on hypothesizing about the diameter of a drop of blood that is splattered. To test their theories, learners work in groups to make blood droplets splatter from different heights. They use graphed...
Illustrative Mathematics
Find the Change
This exercise is an opportunity for algebra learners to understand the connection between the slope of a line and points found on the line. Use similar triangles to explain why slope m is the same between any two points. Discuss with the...
Curated OER
Creating Climographs
Students use satellite data to compare precipitation and surface temperatures on different islands. In this satellite lesson plan students create graphs and explain the differences between weather and climate.
Curated OER
Carbon Monoxide and Population Density
Tenth graders investigate the carbon monoxide level at a fixed latitude. They determine if there is a relationship to population density. They download data sets and generate a graph. They determine a link between human activity and...
Curated OER
Differences Between Ground and Air Temperatures
Students examine the differences between air temperature and ground temperature. In this investigative lesson plan students find NASA data on the Internet and use it to create a graph.
EngageNY
Matrix Notation Encompasses New Transformations!
Class members make a real connection to matrices in the 25th part of a series of 32 by looking at the identity matrix and making the connection to the multiplicative identity in the real numbers. Pupils explore different...
Curated OER
Algebra 1: Slope as Rate
Students solve problems with slopes. In this algebra lesson, students identify the slope of a line and relate it to the rate of change. They graph their lines on the TI and observe changes in the lines.
Curated OER
Building a General Quadratic Function
Learners rewrite a general quadratic function by completing the square to see a new form of the function that more easily identifies the x-coordinate of the vertex and the two roots of the function.
Curated OER
Understanding Weather and Climate Patterns
Learners research the climate patterns of various locations and make predictions based on their findings. They determine the importance of latitude and longitude in weather and climate. Students create graphs displaying their collected...
Curated OER
Exploring Transformations
Students explore what happens when geometric figures are transformed on the coordinate plane. They work in pairs, moving geometric shapes in the plane, and formalize their rules as functions.
EngageNY
Ferris Wheels—Tracking the Height of a Passenger Car
Watch your pupils go round and round as they explore periodic behavior. Learners graph the height of a Ferris wheel over time. They repeat the process with Ferris wheels of different diameters.
Curated OER
Art Class, Variation 1
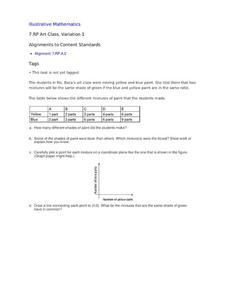
Student statisticians calculate ratios to determine how many shades of green were mixed by Ms. Baca's art class. They graph the number of blue parts against the number of yellow parts for each combination and discover that some produce...
Curated OER
Understanding Growth of the Phoenix Area
Young scholars study the growth of the Phoenix area using geographic images, maps, tables, and graphs. They study the idea of community.
Curated OER
Functions - Intro and Inverses
Define the terms domain, range, function, vertical limit test, and linear function notation with your class. They can then, graph several equations applying the vertical line test to determine which are and which are not functions, write...
Teach Engineering
Can You Resist This?
Some things are hard to resist. Small collaborative groups build circuits and calculate the voltage using Ohm's Law. Budding engineers explore the connection between the voltage across different resistors and linear...
Other popular searches
- Coordinate Graphing Pictures
- Holiday Coordinate Graphing
- Graphing Coordinate Planes
- Coordinate Graphing Worksheets
- Cartesian Graphing Pictures
- Coordinate Graphing Art
- Using Coordinate Graphing
- Coordinate Graphing Practice
- Algebra Coordinate Graphing
- Coordinate Graphing Distance
- Graphing Coordinate Pairs
- Graphing on a Coordinate Grid


