Curated OER
What Are You Eating?
Discover the calorie content of foods by observing how much heat they produce in water. If you have a calculator-based laboratory (CBL™) insturment for collecting data, then this laboratory worksheet will not need any changes. If...
Curated OER
Sink/Float Discovery bottle
Investigate which items float and which ones sink using this resource. Learners participate in an activity in which they investigate this phenomena. Then they describe the experimental process, and learn how to display their results.
Curated OER
Re-Presenting Race in the Digital Age
Teen-aged scientists analyze a graphic organizer of how trash is removed from New York City and then answer standard questions about a graph and a diagram. Resources are mentioned, but there are no links to these resources, so you will...
Multiverse
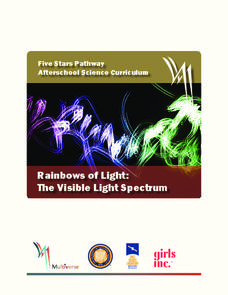
Rainbows of Light: The Visible Light Spectrum
Rainbows can teach us about the visible light spectrum. Learners observe multiple items that clearly display a rainbow to develop better connections. The lesson then explains wavelength using a rope to make waves.
Curated OER
Breakfast Cereal - How Nutritious Is Yours?
Students analyze the nutritional value of breakfast cereal in order to make an informed choice. They create a stem and leaf plot which analyzes the nutritional value of the cereal they eat on a regular basis. Students write a letter to...
Curated OER
Graphing With Paper and Computers
Fourth graders construct bar graphs. For this graphing lesson, 4th graders create bar graphs in connection with the story, The Copycat Fish. After creating the initial graphs on paper, students use MS Excel to create graphs.
Curated OER
Cent Sense
Students identify money values. In this money lesson, students sort and group coins by value and investigate the cost of supplies needed for a snack. Students prepare snacks for a snack sale.
Curated OER
Food Classification
Students are introduced to classification and some of the difficulties surrounding classification and how classification systems need to be able to adapt and how they may need to be changed when new information is discovered. They...
EngageNY
More Practice with Box Plots
Don't just think outside of the box — read outside of it! The 15th lesson in a 22-part unit provides pupils more work with box plots. Learners read the box plots to estimate the five-number summary and interpret it within the context....
EngageNY
Presenting a Summary of a Statistical Project
Based upon the statistics, this is what it means. The last lesson in a series of 22 has pupils present the findings from their statistical projects. The scholars discuss the four-step process used to complete the project of their...
EngageNY
Relationships Between Two Numerical Variables
Working in small groups and in pairs, classmates build an understanding of what types of relationships can be used to model individual scatter plots. The nonlinear scatter plots in this lesson plan on relationships between two numerical...
Curated OER
Virtual Field Trip
This hands-on resource has future trip planners analyze graphs of mileage, gasoline costs, and travel time on different routes. While this was originally designed for a problem-solving exercise using a Michigan map, it could be used as a...
Curated OER
A Lesson in Biodiversity: Making Comparisons Between Defensive Mechanisms Utilized by Marine Organisms
If your upper elementary or middle school marine biology learners are going to visit an aquarium, then here is a field trip activity guide for you. It is written specifically for The Maritime Aquarium, but the idea can be adapted to...
Curated OER
Weather "Whys" Lesson 4: Spring
Pupils explore the attributes of spring. In this weather lesson, students collect data regarding weather from various media. Pupils graph simple weather data and dress animals for forecasted weather. Students discuss the characteristics...
Curated OER
Graphing
Students collect data to create different types of graphs-line, pie, and bar graphs. They use StarOffice 6.0 to create graphs.
Curated OER
comparison of Two Gender Sports Teams
Students gather data on sports team and create a box and whisper plot. In this data collection lesson, students find the median, the quartile range, and relationships between variables.
Curated OER
Radiation and Color
Tenth graders explore the relationship between color and heat absorption by measuring the temperature change of water in differently colored test tubes as they are exposed to a heat lamp. They work in small groups to collect data and...
Curated OER
How Far Did They Go?
Students create a map. In this direction and distance instructional activity, students come up with familiar places in the community and calculate the distances from these places to the school. Students create a map that displays these...
Curated OER
Comparing Costs
Students compare the costs of two cellular phone plans and determine the best rate. They use a table and a graph of points plotted on a Cartesian plane to display their findings. Students write an equation containing variables that could...
Curated OER
Percents: What's the Use
Students research percentages in real world situations. In this percents instructional activity, students demonstrate their ability to apply percents to everyday situations. Students communicate mathematically by conducting interviews...
Curated OER
Regions of the United States
Fifth graders collect data about regions of the United States using the Internet, library books, and encyclopedias. They write an essay persuading people to visit their state.
Curated OER
Math: Graphs and Their Symbols
Second graders examine different types of graphs and discover the meanings of the symbols used on them. After gathering data about themselves, their communities, and the world, they use that information to create graphs. Among the...
Curated OER
Linear Equations
Students discover the equation of a line. They accurately record data collected from the game, "You're On A Roll", create number sentences by rolling dice, and choose their own values for the multiplication and addition steps.
Curated OER
Building an Empire Mapping China
Learners create travel brochures of China's nine regions and make a bulletin board display with them.
Other popular searches
- Data Display
- Misleading Data Display
- Appropriate Data Display
- Graphs and Data Display
- Display Simple Data
- Analyze Data Displays
- Data Display Center
- Voluntary Data Display
- Best Data Display
- Rates and Data Display
- Simulation Data Display
- Ways to Display Data


