Curated OER
How Long Can You Go?
Eighth graders examine the usefulness of a line of best fit by collecting and graphing data, using a graphing calculator to determine the line of best fit, and making a variety of predictions. They watch a video, then design a...
Spartan Guides
Infographics Lesson
An infographic is fantastic way for learners to illustrate their understanding of content, express themselves creatively, and teach others in a manner that is both engaging and informative. While originally designed for a lesson on...
Statistics Education Web
Sampling in Archaeology
Compare different random sampling types using an archaeological setting. Scholars collect data from an archaeological plot using simple random samples, stratified random samples, systematic random samples, and cluster random samples....
Charleston School District
The Line of Best Fit
If it's warm, they will come! Learners find a line of best fit to show a relationship between temperature and beach visitors. Previous lessons in the series showed pupils how to create and find associations in scatter plots. Now, they...
Weather Bug
WeatherBug
Exploring the weather has never been more intriguing! Whether you are looking for a quick glance at the 10-day forecast, trying to figure out if lightning is heading your way, or wondering what the pollen count is, you will find out...
NOAA
Ocean Layers II
Now that you know the ocean has layers, let's name them. The seventh installment of a 23-part NOAA Enrichment in Marine sciences and Oceanography (NEMO) program covers terminology associated with ocean layers, such as thermocline and...
Nuffield Foundation
Angles
Your learners practice the foundations of measuring two-dimensional angles. As well as the explanation of how to measure angles and their classifications, learners have plenty of practice problems on this instructional activity.
Polar Trec
Bering Sea Fabulous Food Chain Game
In spring, the Bering Sea turns green due to phytoplankton, which live at the surface, experiencing a population explosion. Groups of scholars play a food chain game, writing down food chains as the game is played. After five to six...
Advocates for Human Rights
A Global Perspective on Immigration
To gain a global perspective on immigration, groups investigate and create a map of the migration patterns in Africa, Asia, Europe, Latin America, and the Middle East. Class members then examine the background, immigration history, and...
CK-12 Foundation
CK-12 Middle School Math Concepts - Grade 6
Twelve chapters cover a multitude of math concepts found in the Common Core standards for sixth grade. Each title provides a brief explanation of what you will find inside the chapter—concepts from which you can click on and learn more...
Chicago Botanic Garden
Unit 2 Pre-test, Grades 7– 9
This pre-assessment launches a unit on climate change and weather. 15 questions, both short answer and multiple choice, asses the classes' knowledge about these concepts.
Curated OER
Interpolating Function
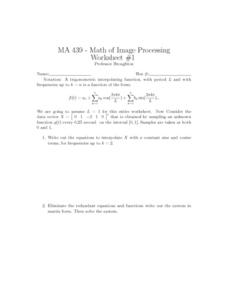
In this interpolating function activity, students solve 7 different sets of problems that include determining the interpolating function of each. They write out the equations to interpolate with a constant sine and cosine terms. Then,...
Curated OER
Walking the Plank: Student Worksheet
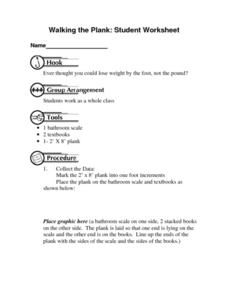
For this math worksheet, students will work in a group to experiment with the weight of objects when placed at a distance from a scale (using a plank). Students will record and graph their results.
Curated OER
Absolute Zero Lab
In this absolute zero worksheet, learners experiment with a closed-end syringe and a ice bath and boiling water. They record volumes of gases in the syringe as well as temperatures of the water and they plot their experimental data. They...
Curated OER
More Graphing Situations by Making a Table
Students calculate rate of change and graph linear functions. In this algebra instructional activity students write linear functions, make a table of points and graph their data on a coordinate plane. They calculate the rate of change of...
Curated OER
Room Temperature Investigation
While the topic of this investigation is not specific to any particular discipline of science, it does serve as a practice of the scientific method. Learners set up a bowl containing boiling water, one with room temperature water, and...
Curated OER
Practicing Scientific Literacy
In this science worksheet, students read an article that is scientifically based and decide how to respond to it. They respond to each of the statements listed using their article. Students also write a paragraph about one impact that...
Curated OER
Rocketsmania And Slope
Students use a professional basketball team's data and graph it on a coordinate plane. They draw a line of regression and finding its equation. They access a website containing statistics for the Houston Rockets basketball team to solve...
Curated OER
High and Low Tides
Students collect real world data from the Web regarding high and low tides at various locations in the United States. They find a function which models this data and make predictions on tide levels based on the information found.
Curated OER
Finding the Basal Area of a Forest Plot to Determine Stocking Levels
Learners use graphs and plots to measure the basal area and stocking levels. In this graphing instructional activity students work in the field the use their data to help them complete a lab activity.
Curated OER
Move It
Studens collect and graph data. In this algebra activity, young scholars use a CBL and CBR with a TI Calcualtor to observe linear graphs. They use the correct vocabualry as they discuss the collected data.
Curated OER
Box-and-Whisker
Seventh graders are introduced to the concept of box-and-whisker plots. A step-by-step process for creating a box-and-whisker plot is provided. The goal of the instructional activity is that students study the components of a...
Curated OER
Writing in the Math Classroom
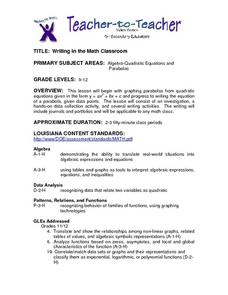
Students determine the vertex, y-intercept and direction of a parabola and write an explanation of how to graph a parabola. They collect and graph data using a calculator.
Curated OER
Scatterplots
In this scatterplots learning exercise, students construct a scatter plot from a given data set. Students then answer 4 questions regarding the least-squares regression line and making predictions.


