Illustrative Mathematics
Mr. Brigg's Class Likes Math
A quick discussion question that brings some collaboration into your classroom will allow your thinkers to make a decision about sampling. Mr. Briggs wants to know if the results from his class are a valuable comparison to the entire...
Illustrative Mathematics
Weather Graph Data
Teaching young mathematicians about collecting and analyzing data allows for a variety of fun and engaging activities. Here, children observe the weather every day for a month, recording their observations in the form of a bar graph....
Illustrative Mathematics
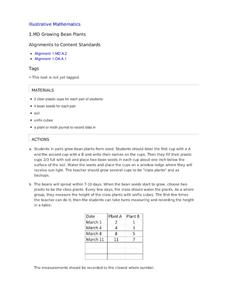
Growing Bean Plants
Plant growth experiments offer rich, cross-curricular learning opportunities that can really excite and engage young learners. For this series, children work in pairs planting, measuring, and comparing the height of bean plants in order...
Bridges In Mathematics
Grade 2 Comprehensive Growth Assessment
Need to know if your students comprehend all the Common Core standards covered in second grade? This growth assessment will let you know. Find out if your second graders can add/subtract, tell the time, read a bar graph, know their...
Mathed Up!
Two Way Tables
When presented with categorical data, a two-way frequency table is a great way to summarize the information. Pupils organize categorical data using a two-way table, then use the tables to determine missing data and to calculate simple...
EngageNY
Ratios II
Pupils continue the study of ratios by creating ratios from a context. The contexts present more than two quantities, and scholars create contexts that match given ratios.
Noyce Foundation
Truffles
Knowing how to scale a recipe is an important skill. Young mathematicians determine the amount of ingredients they need to make a certain number of truffles when given a recipe. They determine a relationship between ingredients given a...
Curated OER
Linear or Exponential?
Your learners analyze various real-life contexts to decide if each is a linear or exponential model. This could be used as an assessment of learners' skills of discerning between a linear and an exponential model.
Curated OER
Choral Counting I
Using a 100s chart or a number line with a pointer, work with your class to count up to 100 by ones and tens. As a part of daily instruction, prompt your kindergartners to chant count from 1 to 30. Move on to 1 to 50, and then from 1 to...
Virginia Tech
Unit Plan: Exponential and Logarithmic Functions
A six-day unit for algebra II on exponential and logarithmic functions builds upon Chapter 12 of Merrill Algebra II with Trigonometry; Applications and Connections. The text provides assistance in the depth of instruction...
Concord Consortium
Leap Years and Calendars
How many birthdays do leap year babies have in a lifetime? Learners explore the question among others in a lesson focused on different calendar systems. Given explanations of the Julian, Gregorian, and Martian calendars, individuals use...
Mathematics Assessment Project
College and Career Readiness Mathematics Test A2
A six-page evaluation covers material included in algebra, geometry, and algebra II. Applied word problems are mixed in with short answer questions. It also provides questions on mathematical reasoning.
Concord Consortium
The Bus Route
Patterns are extremely helpful when solving a puzzle. Young scholars attempt to find times a bus will pass each stop. They identify a pattern in the known stop times to identify the solutions.
Mathed Up!
Pie Charts
Representing data is as easy as pie. Class members construct pie charts given a frequency table. Individuals then determine the size of the angles needed for each sector and interpret the size of sectors within the context of frequency....
EngageNY
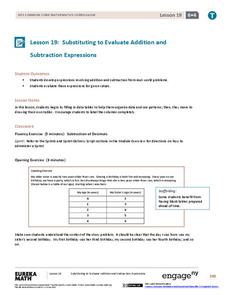
Substituting to Evaluate Addition and Subtraction Expressions
Substitute this resource for what you used to use. Learners identify patterns in data tables and write addition and subtraction expressions to represent relationships. Substitution allows them to solve problems in context in the 20th...
Illustrative Mathematics
Lake Algae
Introduce learners to exponential growth with this real-world problem about algae that is rapidly spreading across a lake in a city park. The task presents the rate of growth and an end value and asks learners to determine what happened...
Curated OER
Fred's Fun Factory
Round and round and round she goes. Where she stops, nobody knows. This activity uses a common arcade game of chance, the spinning wheel, as a platform for computing expected values, interpreting results, and applying this knowledge to...
Illustrative Mathematics
Fred's Fun Factory
Spin to win! Individuals calculate the average number of tickets expected based on a probability distribution for the number of tickets per spin. Pupils use that information to determine the average number of tickets that can be won...


