EngageNY
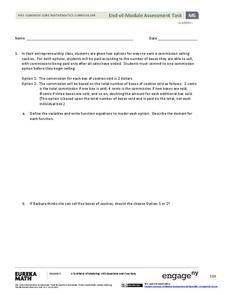
End-of-Module Assessment Task - Algebra 1 (Module 5)
This unit assessment covers the modeling process with linear, quadratic, exponential, and absolute value functions. The modeling is represented as verbal descriptions, tables, graphs, and algebraic expressions.
Curated OER
A Sum of Functions
Collaborative learners will see the geometric addition of functions by graphing the sum of two graphed curves on the same coordinate plane. This task then naturally flows into giving learners the algebraic representation of the curves...
Inside Mathematics
Sorting Functions
Graph A goes with equation C, but table B. The short assessment task requires class members to match graphs with their corresponding tables, equations, and verbalized rules. Pupils then provide explanations on the process they used to...
Inside Mathematics
Functions
A function is like a machine that has an input and an output. Challenge scholars to look at the eight given points and determine the two functions that would fit four of the points each — one is linear and the other non-linear. The...
EngageNY
Properties of Trigonometric Functions
Given a value of one trigonometric function, it is easy to determine others. Learners use the periodicity of trigonometric functions to develop properties. After studying the graphs of sine, cosine, and tangent, the lesson connects...
Inside Mathematics
Conference Tables
Pupils analyze a pattern of conference tables to determine the number of tables needed and the number of people that can be seated for a given size. Individuals develop general formulas for the two growing number patterns and...
EngageNY
Mid-Module Assessment Task - Algebra 1 (Module 3)
Having trouble finding performance task questions? Here is an assessment that uses all high-level thinking questions. It includes questions to assess sequences, linear functions, exponential functions, and increasing/decreasing intervals.
EngageNY
Modeling a Context from a Verbal Description (part 1)
When complicated algebraic expressions are involved, it is sometimes easier to use a table or graph to model a context. The exercises in this lesson are designed for business applications and require complex algebraic...
EngageNY
End-of-Module Assessment Task - Algebra 1 (Module 4)
Critical thinking is an important aspect of mathematics — it's time to put your brain to work! Use this assessment to challenge pupils and test their skills. Concepts assessed include function notation, factoring, completing the square,...
Curated OER
What Functions do Two Graph Points Determine?
Your algebra learners write linear, exponential, and quadratic equations containing the same two graph points in this collaborative task.
Virginia Tech
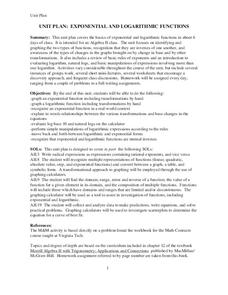
Unit Plan: Exponential and Logarithmic Functions
A six-day unit for algebra II on exponential and logarithmic functions builds upon Chapter 12 of Merrill Algebra II with Trigonometry; Applications and Connections. The text provides assistance in the depth of instruction...
EngageNY
Modeling a Context from Data (part 2)
Forgive me, I regress. Building upon previous modeling activities, the class examines models using the regression function on a graphing calculator. They use the modeling process to interpret the context and to make predictions...
EngageNY
From Ratio Tables, Equations and Double Number Line Diagrams to Plots on the Coordinate Plane
Represent ratios using a variety of methods. Classmates combine the representations of ratios previously learned with the coordinate plane. Using ratio tables, equations, double number lines, and ordered pairs to represent...
EngageNY
Linear and Nonlinear Expressions in x
Linear or not linear — that is the question. The lesson plan has class members translate descriptions into algebraic expressions. They take the written expressions and determine whether they are linear or nonlinear based upon the...
EngageNY
Analyzing a Data Set
Through discussions and journaling, classmates determine methods to associate types of functions with data presented in a table. Small groups then work with examples and exercises to refine their methods and find functions that work...
EngageNY
Analyzing a Verbal Description
What function will describe the insect population growth? Pairs or small groups work together to determine which type of function and specific function will model given scenarios. The scenarios differentiate between linear,...
Curated OER
Equal Differences Over Equal Intervals 2
Your algebra learners explore linear functions concretely using tables of values in a collaborative task. The idea that linear function values change by equal differences over equal intervals, is emphasized. The slope and...
Curated OER
Equal Factors Over Equal Intervals
Exponential functions and their growth rates are explored concretely using tables in a collaborative task. Then the successive quotient is explored algebraically.
West Contra Costa Unified School District
Key Features of Graphs
The key is ... After a day of instruction on key features of graphs, groups create a poster and presentation on the key features of their given function graph. The resource provides an extension activity of "telephone" using...
Curated OER
Latitude
Your young geologists generate a graph given a table of values from the context of latitude and percent of the earth's surface north of that latitude. The questions in the activity then focus the learners to a deeper understanding of the...
Inside Mathematics
Graphs (2007)
Challenge the class to utilize their knowledge of linear and quadratic functions to determine the intersection of the parent quadratic graph and linear proportional graphs. Using the pattern for the solutions, individuals develop a...
Illustrative Mathematics
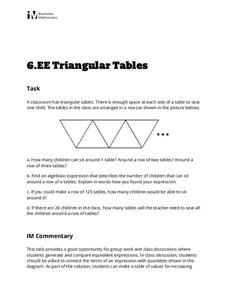
Triangular Tables
Somewhat of a puzzle, this problem gets pre-algebra preteens to write an expression representing a seating chart using triangle-shaped tables. This single task is an applicable lesson for meeting sixth grade Common Core math standards....
Noyce Foundation
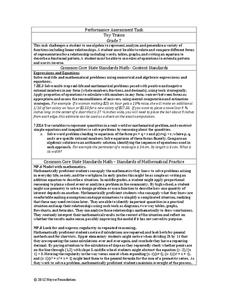
Toy Trains
Scholars identify and continue the numerical pattern for the number of wheels on a train. Using the established pattern and its inverse, they determine whether a number of wheels is possible. Pupils finish...
Noyce Foundation
Ducklings
The class gets their mean and median all in a row with an assessment task that uses a population of ducklings to work with data displays and measures of central tendency. Pupils create a frequency chart and calculate the mean and median....


