Curated OER
How Do You Graph a Rational Function by Making a Table?
Make a table to graph a rational equation. Make a list of values for x and plug them into the expression to get the y value. Then plot the ordered pairs on a graph. Hey, this graph looks funny! Something about asymptotes. Watch closely...
Khan Academy
Testing If a Relationship is a Function, Functions and Their Graphs, Algebra II
This short video looks at different points on a coordinate plane and answers a question about whether these points could represent a function. The answer is determined by looking at each point individually to determine whether, given a...
Brightstorm
Exploring Quadratic Graphs - Concept
Show your class how to use properties to make graphing easier with a resource that explores the graphs of quadratics. Using tables to determine the points to graph, pupils discover the symmetry of parabolas in...
Mathispower4u
Introduction to Functions - Part 2
Let the video function as a catalyst to study functions. Young mathematicians watch a short video to continue learning about functions. They watch as the narrator completes function tables by evaluating functions for specific values,...
Math Antics
What Are Functions?
Setup the idea of functions for the class. Using sets, the presentation introduces the concept of a function. The initial example uses a general function but then moves on to equations as functions. The video provides an example of an...
Curated OER
How Do You Make a Table for a Quadratic Function?
Making a table for a quadratic function is not so complicated. Here are a few tricks to make it easier. One trick is to find the axis of symmetry and another is to find the vertex. These two values can be used to pick values to plug in...
Curated OER
How Do You Graph a Quadratic Function?
What things need to be done to graph a quadratic function? Well, first, find the axis of symmetry, then find the vertex of the parabola, then create a table and plug in some x-values to get the resulting y-values. Now write the values as...
Northeast Arkansas Education Cooperative
Functions
One in, one out is what functions are about in a video explaining the rules and qualities of these relationships. Have your learners practice with ordered pairs, tables, mapping, and graphs, deciphering whether or not those relationships...
Corbett Maths
Drawing Graphs Using Xy Tables
What does a linear equation look like in a table? A video lesson practices graphing linear equations by making an input-output table. The instructor emphasizes the pattern in the table and relates that to the graph of the function.
Northeast Arkansas Education Cooperative
Function Families and Their Connections Including Vertical Shift of an Absolute Value Function
One of the strongest tools an algebra learner develops is the ability to quickly and accurately graph almost any given function. Often doing this quickly and accurately requires rigid transformations to a parent function,...
Khan Academy
Connection Between Even and Odd Numbers and Functions, Algebra II
Are odd numbers connected to odd functions and even numbers to even functions? This video tries to clarify that connection. It also discusses functions that are neither odd nor even to help you classify them more intuitively.
Flipped Math
Modeling with Graphs
Create a graph for anything in the world. Pupils continue to work with graphs that model situations. The learners analyze different graphs to answer questions about the scenario along with finding equations of graphs. Scholars use...
FuseSchool
Plot Straight Line Graphs: Part 1
Demonstrate how to create an input-output table to graph a linear function with a video lesson that begins with evaluating the function for a set of values and then plotting the results. It includes opportunities for learners to practice...
Northeast Arkansas Education Cooperative
Functions
Relationships can be good or bad, but functional relationships are the best! The video demonstrates relationships in a table or graph and what makes their qualities functional. Have your learners review functions and then go through a...
Curated OER
How Do You Figure Out If a Relation is a Function?
If a relation is to be considered a function then the values in the domain can only appear once in the table. It does not matter how many times a value appears in the range. Set up a table using the given values to check and see if the...
Mathispower4u
Using Rates of Change to Build Tables and Graphs - Part 1
Here's a nice, clean resource on rates of change. For an example involving the cost of a carpet cleaning service, scholars watch a video that shows how to create a table of values and a graph. They must determine whether the graph is a...
Mathispower4u
Using Rates of Change to Build Tables and Graphs - Part 2
Let knowledge of rates of change flow into a lesson. By watching a video, pupils see an additional real-world example on rates of change. Using provided information about a leaking water tank, they complete a table of values and plot a...
Curated OER
How Do You Make a Table of Values for a Linear Equation?
Create a table of values based on a given linear equation. Input, output, function. Watch this video and learn how to set up a table to get coordinate points to make a graph of an equation. Make a column of selected x-values. Make a...
Curated OER
How Do You Determine the Zeros of a Polynomial Function from a Table of Values?
First, review the location principle and then use a table to determine the zeros for the function your trying to solve. This tutorial defines the location principle, works through a table, identifies where sign changes occur, then uses...
Curated OER
How Do You Use the Graph of a Linear Equation to Solve a Word Problem?
There are rabbits, rabbits, rabbits everywhere. Not this group of rabbits. Use a table to find some x and y values to create a graph to solve this word problem. It's a rather peculiar word problem in that it is trying to find when a...
National Education Association
Define the Effects of Parameter Changes on Graphs of Linear Functions
Parameters can move and change the steepness of a graph. Introduce the effects of changing the slope or the y-intercept of a linear graph. The resource shows how to incorporate changes on graphs and how they will move up, move down,...
Curated OER
How Do You Graph a Quadratic Equation with No Solution?
There are many ways to solve a quadratic equation. Let's check out how to solve a quadratic equation by graphing. But first, let's find the axis of symmetry and the vertex before making a table of values. Write the values as ordered...
Curated OER
How Can You Tell if a Function is Linear or Nonlinear From a Table?
Is it possible to tell if a table of values represents a linear function or a nonlinear function? One way is to graph the ordered pairs to see if it makes a straight line. But, take a look at the rate of change in the table. If the rate...
Mathispower4u
Graphing Functions by Plotting Points - Quadratic
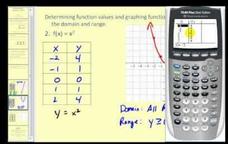
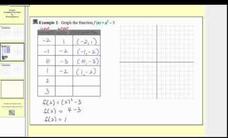
Watch as your knowledge of quadratic functions grows parabolically. An educational video shows scholars how to graph quadratic functions. The method shown here is to create a table of values and graph the function by hand.


