Curated OER
Glass Transition in a Rubber Ball
Students illustrate the changes in the properties of a material at its glass transition point. They gather data which they use to construct graphs regarding elastic modules versus absorption modulus, tangent delta, and the effect of...
CK-12 Foundation
Magnifying Glass
How can a magnifying glass or reading glasses make things appear larger? Scholars simulate moving a lens closer or farther from an object to observe the resulting image. They also alter the lens focal length. The simulation shows the...
Virginia Department of Education
Graphing Linear Equations
Combine linear equations and a little creativity to produce a work of art. Math scholars create a design as they graph a list of linear equations. Their project results in a stained glass window pattern that they color.
Curated OER
Graphs to Represent a Data Set
How many animals did Chaplin see at the zoo? Scholars examine three data sets and create a bar graph for each. Encourage them to label the different parts of their graphs, as this is not prompted on the worksheet. Once they finish their...
Curated OER
Do You Wear Glasses?: Graph
In this bar graph worksheet, students will ask their classmates if they wear glasses or not and record the responses to complete the graph.
Curated OER
The Glass Menagerie: Anticipation Guide
Readers are introduced to the key themes in Tennessee Williams' The Glass Menagerie by this carefully crafted anticipation guide. A great discussion starter.
Curated OER
Watermelon Graphing
Students discover bar graphs. For this primary math lesson plan, students identify the parts of watermelon seeds and other seeds. Students learn the proper names and common names which refer to the parts of the seeds as they create a bar...
Curated OER
Red Worms Rock!
Second graders measure red worms. In this lesson plan, 2nd graders observe and collect data on red worms. Students measure the red worms and create a graph with the data they collect.
Curated OER
Deciding Which Type of Graph is Appropriate
In this graphing worksheet, students read about line, bar, and pie graphs and then determine which graph is the best way to express data results. This worksheet has 3 short answer questions.
Curated OER
Organizing Data Using Tables and Graphs
Students create graphs and tables, as well as interpret and make inferences from the data shown to determine when and where graphs and tables are most useful.
Utah Education Network (UEN)
Mathematics: Growing Patterns
Learners graph growing patterns using ordered pairs on a coordinate grid. They read The Fly on the Ceiling, a Math Myth.
McAuliffe-Shepard Discovery Center
Global Warming in a Jar
This well-organized lab activity introduces earth science pupils to the greenhouse effect. They will set up two experiments to monitor temperatures in an open jar, a closed jar, and a closed jar containing water. Ideally, you would have...
Curated OER
Family Activity: Bar Graphs and Line Graphs
For this math worksheet, students work at home with a family member on a graphing activity. Students count the number of cans, glass jars, boxes and bags in the pantry. Students make a bar and a line graph to represent the data.
Curated OER
Graph our Litter
Eighth graders examine their schoolyard for litter and graph its spread. In this Math lesson, 8th graders present their graphs to other students. Students determine what might be the causes for any differences that they have.
Curated OER
Close Observation: Coins
Integrate math, science, and speaking/listening with a collaborative hands-on activity. Each group works with a single penny, examining it with the naked eye and recording observations. Repeat using magnifying glasses. Then repeat with a...
US Department of Energy
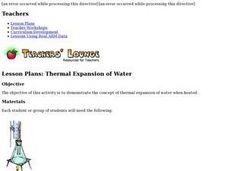
Thermal Expansion of Water: Rise of Sea Level
Using bunsen burners, Erlenmeyer flasks, thermometers, hollow glass tubes, stoppers, and rulers, learners experiment with and measure how water expands when heated. The activity connects the expansion of water when heated to global...
Curated OER
Splish! Splash! From the Bath to my Glass
An excellent instructional activity on the water cycle! In it, learners should gain a general understanding of the water cycle, along with how water first falls as precipitation, then ends up coming out of our faucets. This instructional...
Curated OER
Function-al Machines and Spaghetti Graphs
Sixth graders identify the relationship between patterns and functions. In this algebra instructional activity, 6th graders use a "Functional Machine" to identify the rule. Students use a function table to plot the points using play...
Curated OER
Environmental Graphing
Learners experiment with graphing. In this graphing introduction lesson, students complete four activities: 1) a bar graph based on class birthdays 2) an estimation graph of the raisins in raisin bread 3) another estimation example with...
Alcohol Education Trust
Talk About Alcohol: What is BAC (Blood Alcohol Concentration)?
Educate your class about blood alcohol levels by combining health with math practice. Class members read a little bit about blood alcohol concentration and then solve some problems related to determining alcohol levels and alcohol...
Curated OER
Cindy and Linda Selling Lemonade
For this graphing worksheet, students read a graph, complete a chart about the information, and answer questions. There are fifteen questions in all.
CK-12 Foundation
Malt Shop
How does the soda clerk know exactly how to get the glass across the counter to the customer? Pupils use the simulation to adjust the launch velocity, glass weight, base area, surface material, and the customer's position to answer that...
CK-12 Foundation
Least Time
What is the fastest way to get from point A to point B if you are going through two different mediums, such as air then water? Scholars explore the way light travels through air, water, acrylic, glass, and diamond as they answer this...
101 Questions
Nana's Lemonade
Consistency is the key. One lemon wedge per glass of water makes a nice glass of lemonade. Young scholars must identify the number of lemon wedges they need to make the same lemonade in a big gulp cup. They develop their own solution...


