Curated OER
Twenty-Seven Graphing Lines, Parabolas, and Absolute Value Problems
Have learners find coordinates of point on a graph, find equations of graphs given, and graph given equations using in and out tables. There are 27 problems related to equations for lines, parabolas, and absolute value functions.
Regional Professional Development
Solving Systems of Equations by Graphing
With 30 problems, each accompanied by a blank graph, pupils get thorough practice solving systems of equations by graphing and finding the point of intersection. Answers are provided in coordinate form.
Flipped Math
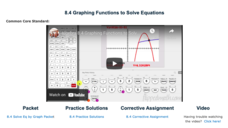
Graphing Functions to Solve Equations
Intersections become solutions. Scholars watch a video on using a graphing calculator to find the solution to an equation in one variable. While watching the presentation, pupils practice working some of the examples and compare their...
Teacher's Corner
Favorite Dr. Seuss Book Graph
What's your class' favorite Dr. Seuss book? Find out using this book graph that lists nine different titles and asks participants to indicate their favorite. Results are then tallied and graphed.
West Contra Costa Unified School District
Using Derivatives to Graph Polynomials
You can learn to graph as well as a calculator using calculus. The lesson introduces using derivatives to find critical points needed to graph polynomials. Pupils learn to find local maximums and minimums and intervals of increase and...
Willow Tree
Graphing
So many methods and so little time! The efficient method of graphing a linear equation depends on what information the problem gives. Pupils learn three different methods of graphing linear equations. They graph equations using...
EngageNY
The Graph of a Linear Equation in Two Variables
Add more points on the graph ... and it still remains a line! The 13th installment in a series of 33 leads the class to the understanding that the graph of linear equation is a line. Pupils find several solutions to a two-variable linear...
Curated OER
Graph, Identify Asymptotes, Find Domain and Range, for Eleven Simple Rational Functions
Using this worksheet, pupils graph 11 simple rational functions. They also find asymptotes, domain, and range for each function. The solutions are provided.
Mt. San Antonio Collage
Graphing Trigonometric Functions
Double win with a comprehensive worksheet and an excellent worked out answer key. The worksheet itself is twelve pages and begins with the simple sine and cosine graphs, then, develops into the reciprocal trig functions.
Flipped Math
Graphing Polynomial Functions
Take a look in the window. Pupils watch a presentation to discover how to graph a polynomial using a graphing calculator and using the window to find the extrema. Scholars use their knowledge from previous lessons to gain a rough idea of...
CK-12 Foundation
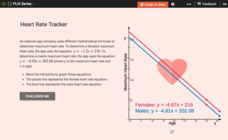
Graphs of Linear Systems: Heart Rate Tracker
Max out heart rates for males and females. Formulas of maximum heart rates provide the equations for a linear system. Pupils use the interactive to graph the equations for males and females and determine their points of intersection. The...
Curated OER
Graphing Ordered Pairs
Are you working on graphing ordered pairs in your class? In this worksheet, learners, after looking over and studying how to graph ordered pairs, plot points on a coordinate grid and connect the dots. Class members also identify what...
Inside Mathematics
Graphs (2006)
When told to describe a line, do your pupils list its color, length, and which side is high or low? Use a worksheet that engages scholars to properly label line graphs. It then requests two applied reasoning answers.
Curated OER
Data Analysis and Probability: Graphing Candy with Excel
Collect and graph data using Microsoft Excel with your math class. They will make predictions about the number of each colored candy in a bag of M&M's, then sort, classify, count, and record the actual data before using Excel to...
Curated OER
Identifying Different Types of Graphs
This is an outstanding presentation on graphs and statistics. Learners choose which type of graph is being shown, and also gain practice in the techniques used to find the mean, median, and mode of sets of numbers. Very good!
Inside Mathematics
Graphs (2007)
Challenge the class to utilize their knowledge of linear and quadratic functions to determine the intersection of the parent quadratic graph and linear proportional graphs. Using the pattern for the solutions, individuals develop a...
Curated OER
Graphing Canada
Students research a province of Canada choosing a question to investigate. They record their information on a worksheet that is provided and complete a graph. They present their bar graphs to the class.
Curated OER
Reading Bar Charts
Help kids understand how to collect data through surveys, organize data in a bar chart, then analyze their findings. There are three different surveys for learners to conduct, a full description of all the parts of a bar chart, and three...
Curated OER
Reading Graphs
Encourage kids to read line graphs with confidence using these examples and accompanying comprehension questions. Learners examine two graphs and answer four questions about each. This is definitely intended for beginners to this type of...
Curated OER
Easter Graphing Fun
Graphing can be festive! This Easter worksheet has scholars using coordinates to record the location of ten holiday images. The first is done for them, and the grid is large and appealing to younger learners. Consider visualizing this...
Curated OER
Graphing the Forecast - Line Graph or Bar Graph?
Sixth graders compare and contrast bar and line graphs. Using a weather forecast of the area, 6th graders record the high and low temperatures in a table. Students determine and justify the most appropriate graph to display a given set...
Curated OER
Graph It!
There is more than one way to represent data! Learners explore ways to represent data. They examine stacked graphs, histograms, and line plots. They conduct surveys and use stacked graphs, histograms, or line plots to chart the data they...
Curated OER
Lesson #46: Bar Graphs and Line Graphs
In this bar graphs and line graphs worksheet, students interpret bar graphs, line graphs, and box-and-whisker plots. They find the measures of central tendency. This three-page worksheet contains notes, vocabulary, and approximately 10...
Curated OER
Chocolate Graphing
Chocolate lovers develop a bar graph based on the types of chocolate the class likes. They participate in The Art of Chocolate at The Hershey Story before they make a bar graph that shows the favorite chocolate types of their class. They...


