Charleston School District
Graphs of Linear Functions
What does a slope of 2/3 mean? Develop an understanding of the key features of a linear function. Pupils graph the linear functions and explain the meaning of the slope and intercepts of the graphs.
CK-12 Foundation
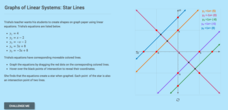
Graphs of Linear Systems: Star Lines
Let the class stars shine. Using four given linear equations, scholars create a graph of a star. The pupils use the interactive to graph the linear systems and determine the points of intersection. Through the activity, classmates...
EngageNY
The Graph of a Linear Equation in Two Variables Is a Line
Show your class that linear equations produce graphs of lines. The 20th segment in a unit of 33 provides proof that the graph of a two-variable linear equation is a line. Scholars graph linear equations using two points, either from...
CPALMS
Writing an Exponential Function from its Graph
Grow an equation for the exponential graph. Given a graph of an exponential function, class members write the equation of the function provided. The graph labels two points on the graph: the y-intercept and the point where x is one.
CK-12 Foundation
Quadratic Functions and Their Graphs: Soccer Ball Trajectory
Determine critical points in the flight of a soccer ball. Pupils use an interactive resource to find the vertex and x-intercepts of the graph of the trajectory of a soccer ball after being kicked. Scholars investigate the trajectory...
Curated OER
Graphing Exponentials
Bring your Algebra class to the computer lab! Using materials created by Texas Instruments, they explore exponentiasl and graphs. Be sure to download the correct materials (on the right side of the webpage) before having them walk...
Flipped Math
Unit 1 Review: Analyze Graphs and Expressions
Get in one last practice. Pupils work through 12 problems and a performance task to review the topics in Unit 1. The problems cover analyzing and modeling with graphs, algebraic properties of equality, and adding, subtracting, and...
Houston Area Calculus Teachers
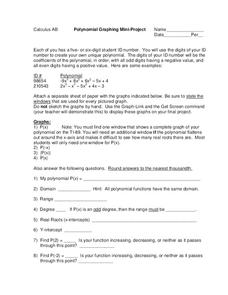
Polynomial Graphing
Your AP Calculus learners probably have their ID numbers memorized, but have they tried graphing them? Pique your pupils' interest by asking each to create a unique polynomial function based on their ID numbers, and then analyze the...
EngageNY
Interpreting Quadratic Functions from Graphs and Tables
Seeing functions in nature is a beautiful part of mathematics by analyzing the motion of a dolphin over time. Then take a look at the value of a stock and maximize the profit of a new toy. Explore the application of quadratics by...
Mathematics Assessment Project
Representing Quadratic Functions Graphically
Sometimes being different is an advantage. An engaging activity has scholars match cards with quadratic functions in various forms. Along the way, they learn about how each form highlights key features of quadratic functions.
Flipped Math
Calculus AB/BC - Sketching Graphs of Functions and Their Derivatives
Find deeper meaning in graphs. Pupils use the knowledge gained from the previous sections in the unit to sketch graphs of a function's derivative. Learners also see how to sketch a graph of a function given the graph of its derivatives....
EngageNY
Graphing Rational Functions
Put everything together in a picture. Scholars take what they learned in the previous three lessons in the 15th segment of a 23-part unit to graph rational functions. They find the end behavior, the horizontal and vertical asymptotes if...
CK-12 Foundation
Graphs Using Slope-Intercept Form: Mountain
Climb every mountain, even one you create in an interactive. Individuals solve a problem involving slopes and distances of campsites on a mountain. Answering a set of challenge questions aids in the process.
Curated OER
Graphing at all Levels: It's a Beautiful Thing!
Mixing math and art is done in this activity by applying graphing knowledge to create a unique piece of art. This activity varies acording to the graphing knowledge of the artist. First, learners identify and review various types of...
Curated OER
Graphing Inequalities
Learners solve inequalities and graph. In this algebra lesson, students rewrite inequalities in the slope intercept form and graph using the slope and intercept. They shade the correct side of the line using greater than or less than as...
Illustrative Mathematics
Graphs of Quadratic Functions
Instead of the typical quadratic questioning, explore the function and look at the three different ways a parabola can be written. The main task is when given several clues, young mathematicians must write an equation that matches the...
CK-12 Foundation
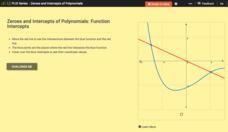
Zeroes and Intercepts of Polynomials: Function Intercepts
There is zero reason not to use the resource. Given a graph with a polynomial function and a linear function, scholars move the line in an interactive. To wrap up the lesson, they note how zeros and intersection points change.
Curated OER
Linear Functions: Slope, Graphs, and Models
This math packet provides an opportunity for learners to graph two linear equations on a coordinate grid and determine the slope and y-intercept of each. They use the equation of five lines to find the slope and y-intercepts, and then...
Curated OER
Graphing
In this graphing worksheet, students solve and graph 10 different problems that include determining various coordinates and the slope. First, they use the table to write the x and y coordinates for each point on the graphs. Then,...
Curated OER
Graphs and Transformations of Functions
Is it possible to solve quadratic equations by factoring? It is, and your class will graph quadratic equation and functions too. They perform transformation on their graphs showing increasing and decreasing intervals, domain, and range....
Curated OER
Graphs of the OTHER Trig Functions
Students graph trigonometric functions. In this precalculus lesson, students identify the properties of secant ,cosecant and cotangent. They use the unit circle as their formula to graph and analyze these functions.
Curated OER
Slope-Intercept Form of a Line
Using the subscriber website Explorelearning.com, young mathematicians observe changes in the slope and y-intercept and their effect on the graph of lines. This activity helps middle schoolers develop an intuitive sense of the connection...
EngageNY
Structure in Graphs of Polynomial Functions
Don't allow those polynomial functions to misbehave! Understand the end behavior of a polynomial function based on the degree and leading coefficient. Learners examine the patterns of even and odd degree polynomials and apply them to...
Curated OER
Point-Slope Form of a Line
This activity helps young mathematicians connect the graph and the point-slope form of a line, by first solving a real-world problem and then using that example to motivate the understanding of the equation. By manipulating the gizmo,...


