Saxon
Plotting Functions
Youngsters use a graphing calculator to assist in creating a function table. They graph the function on a coordinate plane. They explore the relationship between the domain and range in the graph. This four-page worksheet contains two...
5280 Math
Factory Functions
Solve a real-life problem using function-building skills. Presented with an open-ended question, scholars complete a checklist to create and justify a solution in an interesting algebra project. The checklist asks for justifications of...
Illustrative Mathematics
Function Rules
Function machines are a great way to introduce the topic of functions to your class. Here, you will explore the input and output to functions both using numerical and non-numerical data. Learners are encouraged to play with different...
Curated OER
A Sum of Functions
Collaborative learners will see the geometric addition of functions by graphing the sum of two graphed curves on the same coordinate plane. This task then naturally flows into giving learners the algebraic representation of the curves...
Curated OER
Latitude
Your young geologists generate a graph given a table of values from the context of latitude and percent of the earth's surface north of that latitude. The questions in the activity then focus the learners to a deeper understanding of the...
Illustrative Mathematics
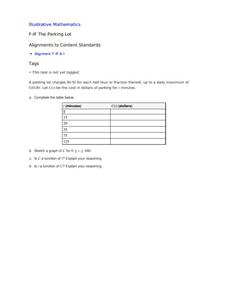
The Parking Lot
Use the real-world cost of parking a car to demonstrate the properties of a function. The resource describes to learners how much it is to park in a certain lot. It is up to your number crunchers to complete a table of minutes...
Curated OER
What Functions do Two Graph Points Determine?
Your algebra learners write linear, exponential, and quadratic equations containing the same two graph points in this collaborative task.
Annenberg Foundation
Skeeters Are Overrunning the World
Skeeters are used to model linear and exponential population growth in a wonderfully organized lesson plan including teachers' and students' notes, an assignment, graphs, tables, and equations. Filled with constant deep-reaching...
101 Questions
Deodorant
Smells like learning! Young scholars collect data on the length of time a stick of deodorant lasts. After modeling the data with a graph and function, they make predictions about deodorant use over time.
PBL Pathways
Medical Insurance
Design a plan for finding the best health insurance for your money. Learners compare two health plans by writing and graphing piecewise functions representing the plan rules. Using Excel software, they create a technical report...
Curated OER
Hand Span and Height
Is there a relationship between hand span width and height? Statisticians survey each other by taking measurements of both. A table that can hold data for 24 individuals is printed onto the worksheet, along with questions for analysis....
Curated OER
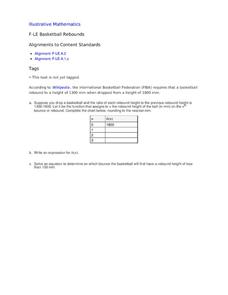
Basketball Rebounds
Your young basketball players will build a table and develop a general formula for a decaying exponential scenario involving the rebound distance of a bouncing ball. Using a CBR and graphing calculator can make this even more hands-on...
Curated OER
Triangles Inscribed in a Circle
Are you tired of answers without understanding? Learners can give a correct response, but do they really understand the concept? Have young mathematicians think deeper about linear functions, angles, and formulas in algebra....
Illustrative Mathematics
US Garbage, Version 1
An interesting example of a discrete function and how it is applies to the real world. This could easily make a good collaborative lesson with an environmental science class. Practice reading a table and drawing a scatter plot make up...
5280 Math
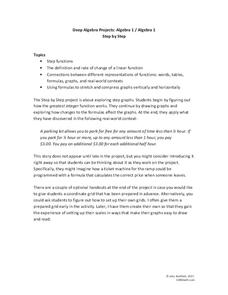
Step by Step
One step at a time! A seemingly linear relationship becomes an entirely new type of function. Young scholars build their understanding of step functions by completing a three-stage activity that incorporates multiple representations of...
5280 Math
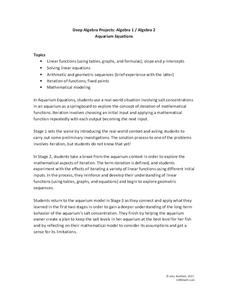
Aquarium Equations
Take a look at linear functions in a new environment. A three-stage algebra project first asks learners to model the salt concentration of an aquarium using linear functions. Then, using iterations, pupils create a set of input-output...
Howard County Schools
Planning for Prom
Make the most of your prom—with math! Pupils write and use a quadratic model to determine the optimal price of prom tickets. After determining the costs associated with the event, learners use a graph to analyze the break even point(s).
Howard County Schools
Generous Aunt
Witness the power of exponential growth with an activity that investigates two different savings plans. Class members create tables of values to see how and when a savings plan increasing exponentially exceeds one increasing linearly.
Howard County Schools
To Babysit or Not to Babysit?
Would you work for a penny today? Use this activity to highlight the pattern of increase in an exponential function. Scholars compare two options of being paid: one linear and one exponential. Depending on the number of days worked, they...
101 Questions
Styrofoam Cups
How many cups does it take to reach the top? Learners attempt to answer this through a series of questions. They collect dimension information and apply it to creating a function. The lesson encourages various solution methods and...
Illustrative Mathematics
Video Streaming
Your movie fans will be interested in this resource. They will compare video streaming plans. One plan charges a set rate per month and a reduced viewing fee, and the other has a flat rate per each video viewed. Unfortunately, students...
Illustrative Mathematics
Invertible or Not?
What determines whether a function has an inverse? Learners investigate that criteria when they examine values in a partially completed input-output table for two different functions. The task is to complete the table so that one of the...
Curated OER
Model Air Plane Acrobatics
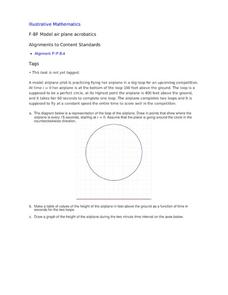
Your young airplane enthusiasts will enjoy this collaborative task of graphing an airplane's distance from the ground as it flies in a perfect circle. They will discover that they have graphed a sinusoidal function that comes from the...
Curated OER
Sandia Aerial Tram
Your learners analyze a table of real-life data in order to write an equation that best models the information. Exponential, quadratic, and linear rates of changes are all possibilities in this task.


