Cincinnati Library
Computers for Beginner
The kids in your class are probably experts at navigating the computer, but do they know the difference between hardware and software? Teach computer skills to any level of computer user with a helpful reference sheet. It...
Curated OER
Drive the Data Derby
Three days of race car design and driving through the classroom while guessing probability could be a third graders dream. Learn to record car speed, distances traveled, and statistics by using calculation ranges using the mean, median,...
Curated OER
Ordinary People: Unsent Letter
Invite your learners to take on the voice of a character from Ordinary People as they write a letter. Pupils use what they know about the given character to compose their letter, which must relate to the plot of the novel.
Teach Engineering
Earthquakes Living Lab: Geology and the 1906 San Francisco Earthquake
We can learn from the past to protect the future. Pairs look at two historical earthquakes: San Francisco, Calif., and Kobe, Japan. Pupils compare the two earthquakes and their impacts, then determine how engineers may use the...
K12 Reader
Tissues, Organs and Systems
Young scientists are introduced to the connections among cells, tissues, organs, and systems in a life science reading comprehension worksheet that asks them to respond to a series of questions based on the passage.
Serendip
How Do We Sense the Flavors of Food?
We taste with our taste buds, so why do flavors change when we have a stuffy nose? Scholars experiment with taste testing while holding their noses and then while smelling. They record their observations in pairs and come together to...
Curated OER
An Introduction to Counting
Students define the counting principle and how it relates to integers. In this algebra lesson, students add and subtract using the addition and multiplication principles. They solve problems using combination and permutations.
Curated OER
Introduction to Bonding
In this chemistry worksheet, students create new and true statements while replacing false ones in order to properly define parts of the concept of bonding.
Curated OER
Introduction to Scientific Theory
Ninth graders explain how scientists set up investigations. In this scientific process lesson, 9th graders review the principles of the scientific method and use these skills to answer an open-ended question about how to set up a...
Curated OER
Introduction to Measures of Central Tendency and Variability
Students calculate the mean, median, mode, range, and interquartile range for a set of data. They create a box and whisker plot using paper, pencil and technology.
Curated OER
An Introduction to Four Groups of Biologically Important Compounds
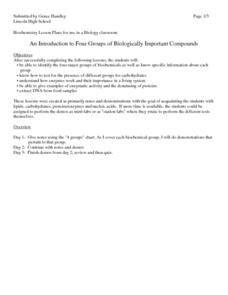
High schoolers learn about the four biochemicals that are important biologically. In this biochemicals lesson plan, students identify the four major groups of biochemicals including carbohydrates, proteins, lipids and nucleic acids. They...
Rice University
Introductory Statistics
Statistically speaking, the content covers several grades. Featuring all of the statistics typically covered in a college-level Statistics course, the expansive content spans from sixth grade on up to high school. Material...
Curated OER
The Crucible by Arthur Miller
Understanding the historical context of Arthur Miller's The Crucible is an important part in understanding the play itself. Over 25 slides, the audience learns details of Miller's early childhood and some major events that were happening...
Curated OER
Intro To The American Revolutionary War (2nd)
Eighth graders explore the events of the American Revolutionary War. After reading The Midnight Ride of Paul Revere, as an introduction to the lesson plan, 8th graders participate in a simulation to experience the Nation of Ms....
Curated OER
Shake It Up with Scatterplots
Students identify how to use a scatterplot to compare two sets of data to determine if they are related. Then they identify and describe the definition of regression line (the "line of best fit"). Students also identify how scientists...
Curated OER
Path to Mars
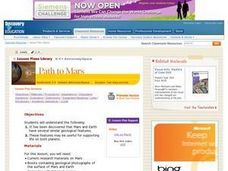
Students compare Earth and Mars to find similarities between the two planets using given websites. They collect and download pictures of geological features of both planets from print and non-print sources. Descriptions of the...
Laboratory for Atmospheric and Space Physics
The Planets and Scale
Scholars gain an insight into the relative size of planets and distance between inner and outer planets with the help of informational text, a data table, and a series of four questions.
Scholastic
Narrative Writing
If you're looking to start a unit based around narrative writing, make sure to consider this resource while you're planning. This book covers five topics: writing personal narratives, writing narratives about others, writing...
Curated OER
4 Discrete Probability Distributions
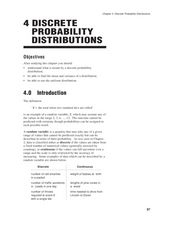
High schoolers read and complete problems on how to solve discrete probability distributions. For this probability distributions lesson plan, students read math problem examples and solve them.
Curated OER
Pizza Possibilities
Students create and interpret line plots, bar graphs, and circle graphs. The lesson assumes mastery of conversions from fraction to decimal to percent, construction of angles, and at least an introduction to graphs displaying data.
University of Washington
Toothpick Fish
With colored toothpicks representing genes, youngsters practice passing them through generations of fish and learn about heredity. Consider this as an introductory activity since it does not represent recessive genes with lowercase...
University of Waikato
Māui and the Sun
Using a Maori legend, How Maui Tamed the Sun, youngsters are introduced to the importance of sunlight to civilization. Teach them about nuclear fusion that occurs to produce the solar energy we later receive on Earth as...
Curated OER
The Mathematical Implications of Lying
Students explore how statistics can be interpreted in different ways. In this probability lesson plan students complete a class lab activity then discuss their findings.
Curated OER
Mean Meadian and Mode
Students apply central tendencies to given data. In this statistics lesson, students calculate the mean, median, and mode as it relates to their data. They collect data and graph it while identifying the way the numbers are ordered.


